Imagen
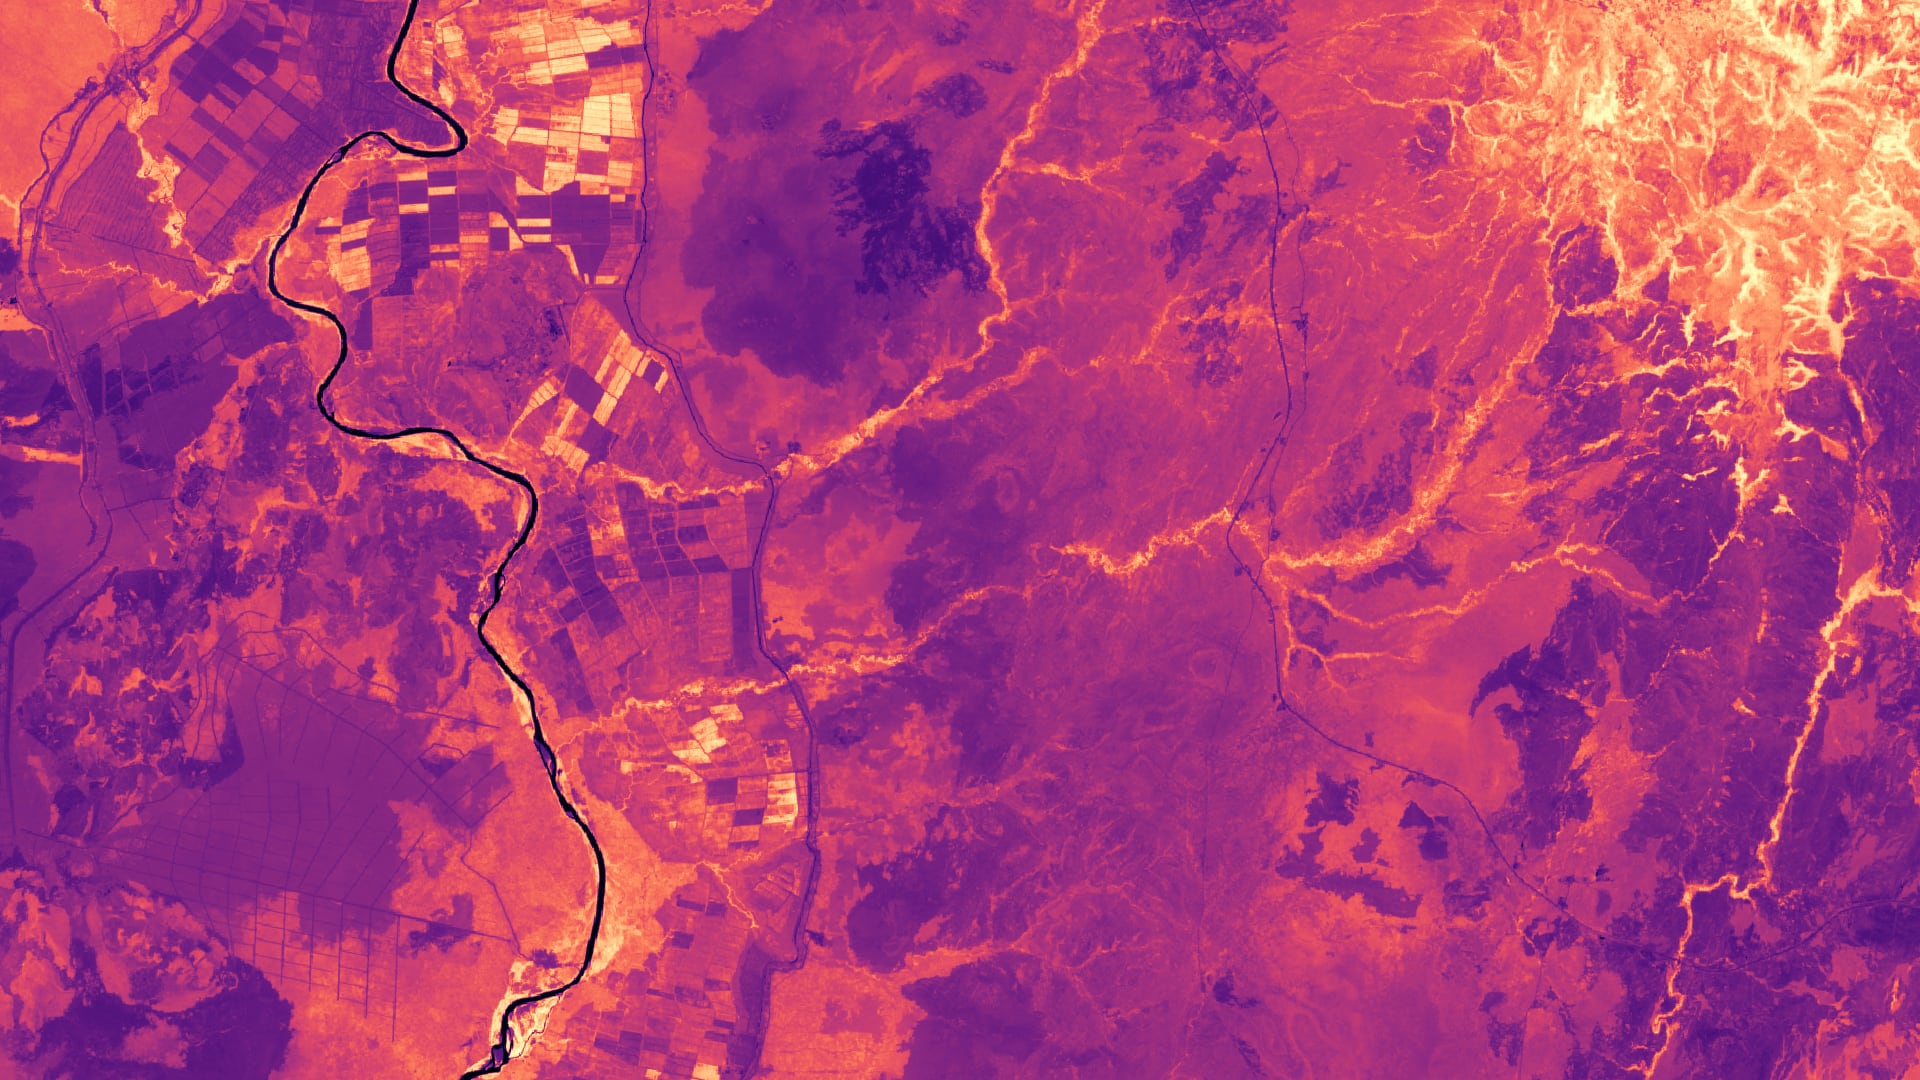
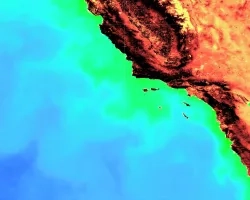
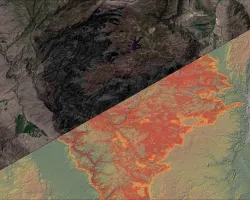
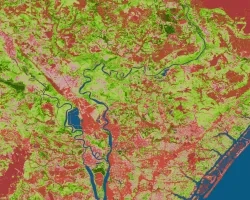
Ethiopia is home to unique wildlife, biodiversity, and ecosystem services and, like much of the world, is undergoing population growth, development, and land use change. As a result, some biodiverse regions may be at risk of being urbanized, cultivated as agricultural plots, or losing access to water bodies that are essential for maintaining both terrestrial and aquatic life. The DEVELOP team partnered with the Ethiopian Wildlife Conservation Authority to quantify the land cover change between the years 1994, 2010, and 2018. The team utilized Ethiopia’s dry season (January to May) for training point development which was crucial in differentiating the level of greenness between the four land cover classes: water, natural vegetation, cultivated land, and bare ground. The study area covered 62,000 km2 of the Lower Omo River Valley and includes eight protected areas. We used Landsat 5 Thematic Mapper, Landsat 7 Enhanced Thematic Mapper Plus, Landsat 8 Operational Land Imager, and Shuttle Radar Topography Mission imagery within Google Earth Engine to employ a Random Forest Classifier and identify these four distinct classes. For each of our supervised classifications, overall model accuracy was between 83% (2018) and 89% (1994). Between 1994 and 2018, the Lower Omo Valley experienced an overall increase of 258.57% in water bodies and 291.23% in cultivated areas, while experiencing an 8.91% decrease in natural vegetation and 18.76% bare ground. There was an increase in water bodies and cultivated land and a decrease in natural vegetation and bare ground in unprotected areas and all protected areas. However, protected areas disproportionately experienced an increase in land cover change, including Tama Community Conservation Area which saw a 17,272.33% increase between 1994 and 2018.