Imagen
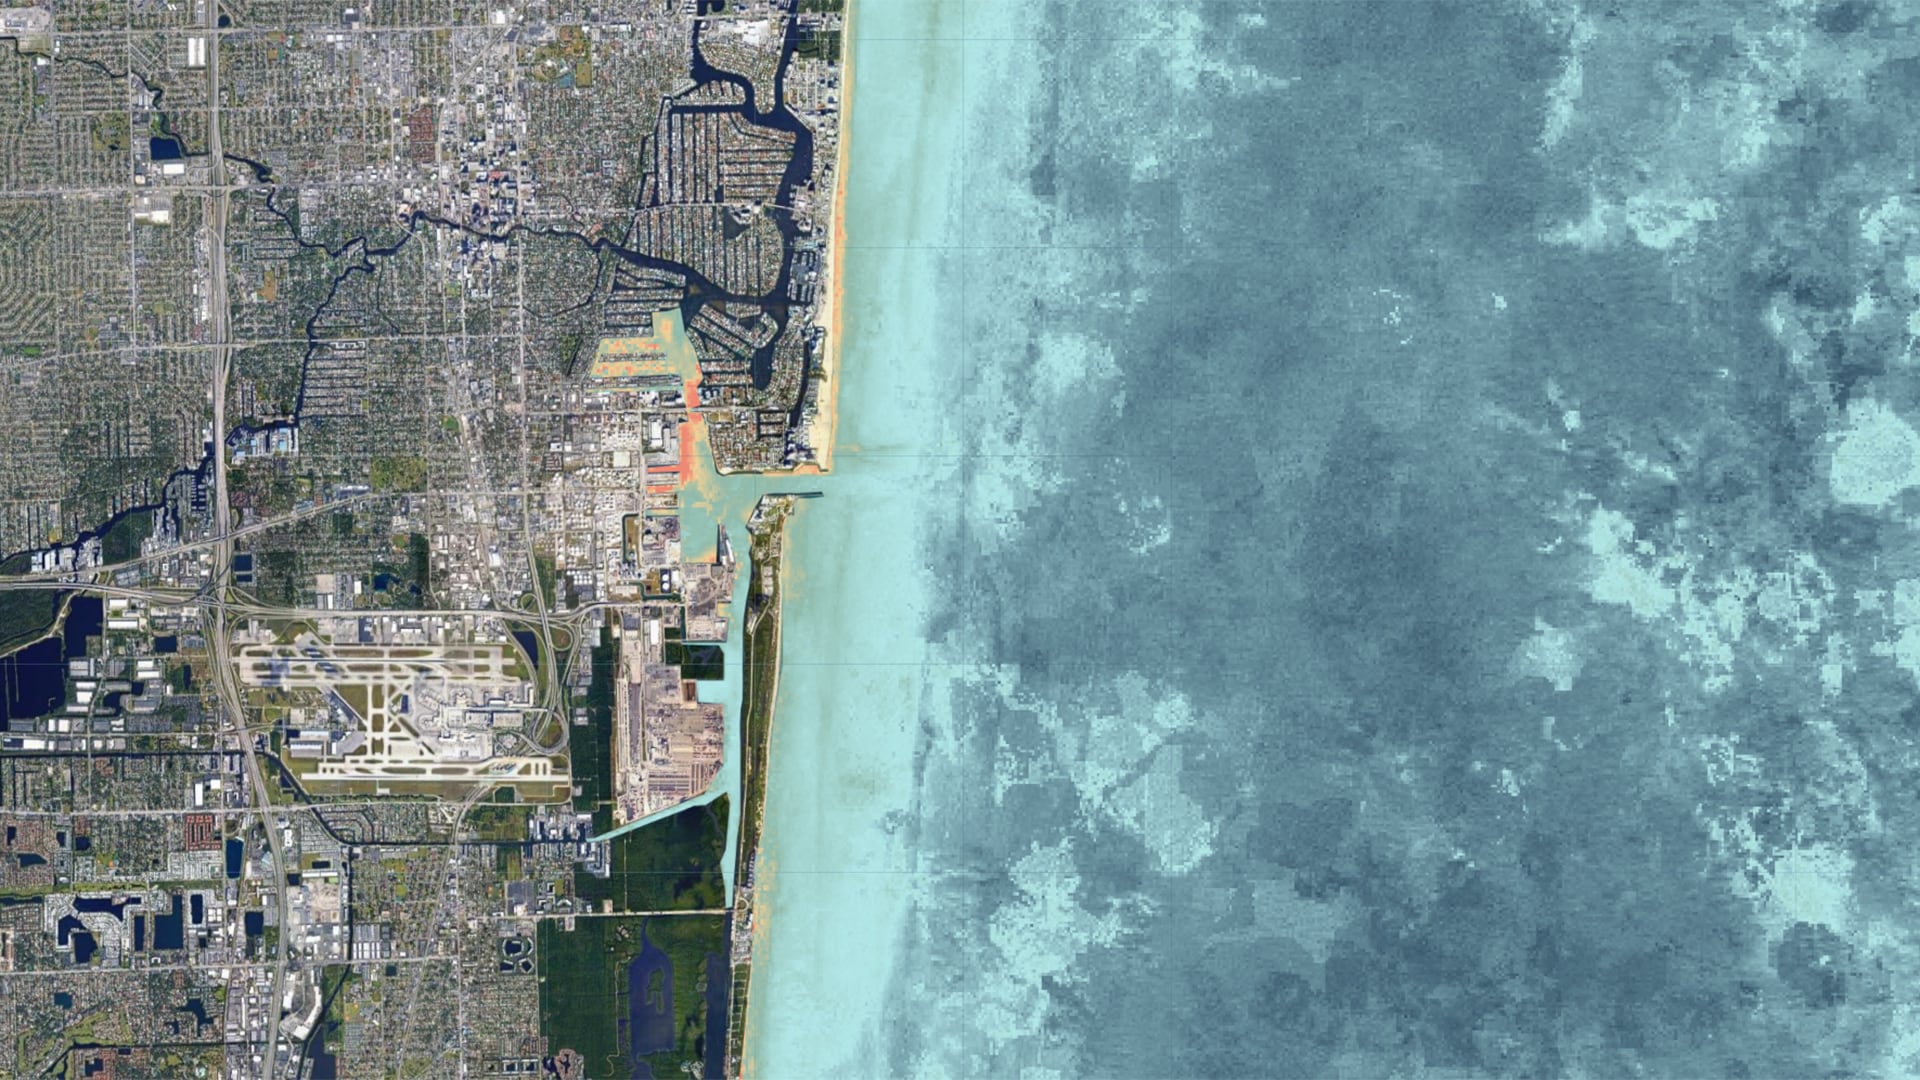
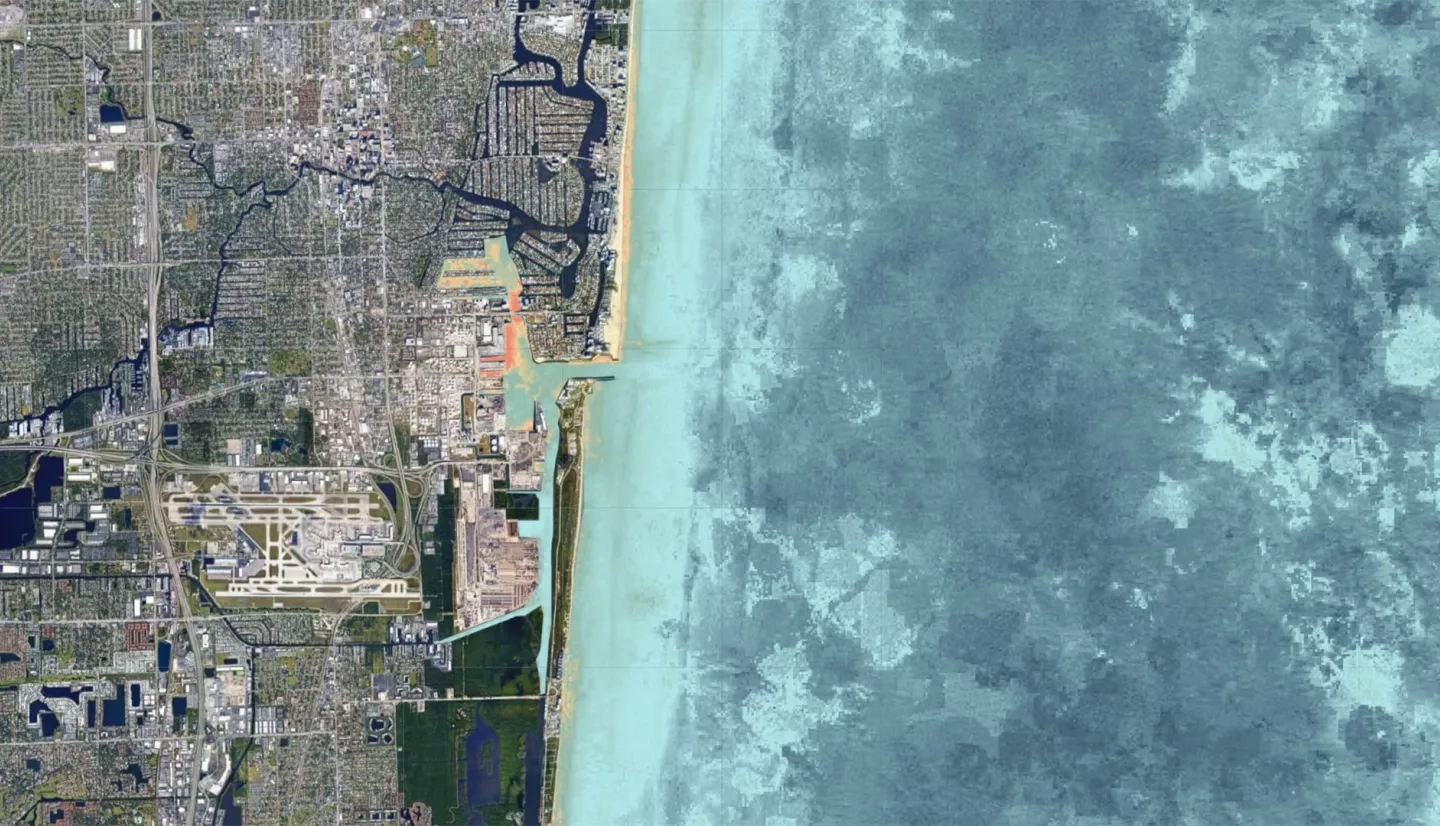
The U.S. Army Corps of Engineers (USACE) and National Oceanic and Atmospheric Administration (NOAA) National Marine Fisheries Service (NMFS) will be supervising a harbor deepening project in Port Everglades, Florida. The project raises concerns about potential impacts on the nearby Florida reef tract through increased turbidity and sediment from the dredging. To better understand these potential impacts, the NASA DEVELOP team created an interactive Google Earth Engine tool to help establish a historical baseline of water quality parameters and assist monitoring these parameters more frequently than traditional sampling. This Seaport & Harbor Area Resource Quality (SHARQ) tool incorporates remotely sensed data from Sentinel-2 Multispectral Instrument, Landsat 5 Thematic Mapper, Landsat 7 Enhanced Thematic Mapper+, Landsat 8 Operational Land Imager, and Aqua Moderate Resolution Imaging Spectroradiometer. It allows users to view true color images and calculate water quality parameters, like turbidity and chlorophyll-a, for any given study area and time period from 1984 onward. The SHARQ tool also generate time series charts, allowing users to interpret changes in water quality over a given time range. The accuracy of the remotely sensed water quality parameter algorithms was determined using in situ data to calculate percent difference and root mean square error values (RMSE), which ranged from 0.32 to 0.58 error between sites. Using the SHARQ tool’s time series analysis feature, a baseline average turbidity metric of ~6.8 FNUs provides a historical baseline average for turbidity between September 2000 and 2020 and can assist in future decision-making for determining thresholds for turbidity.