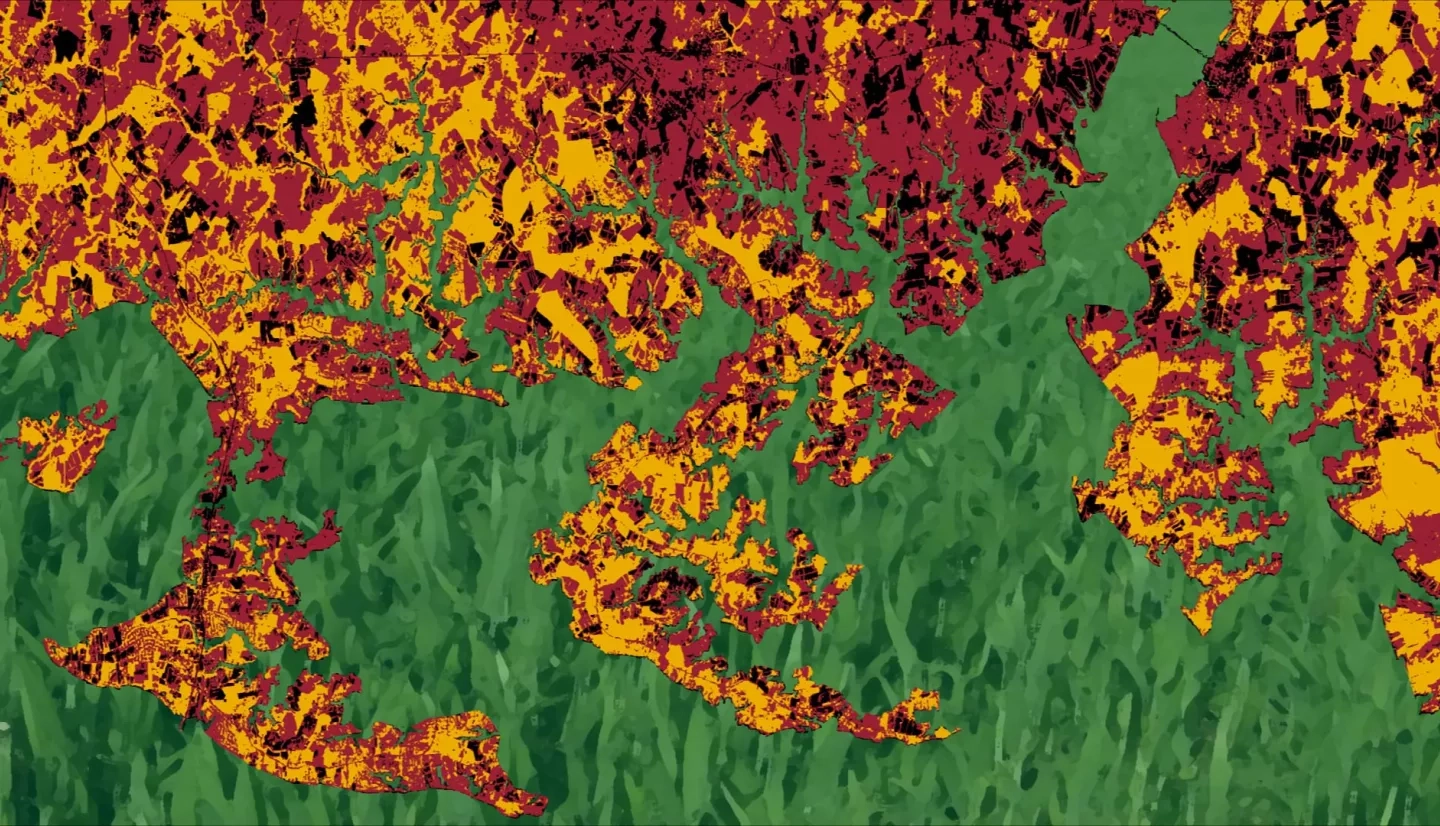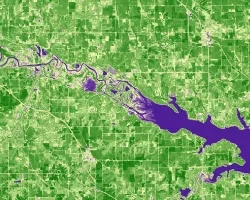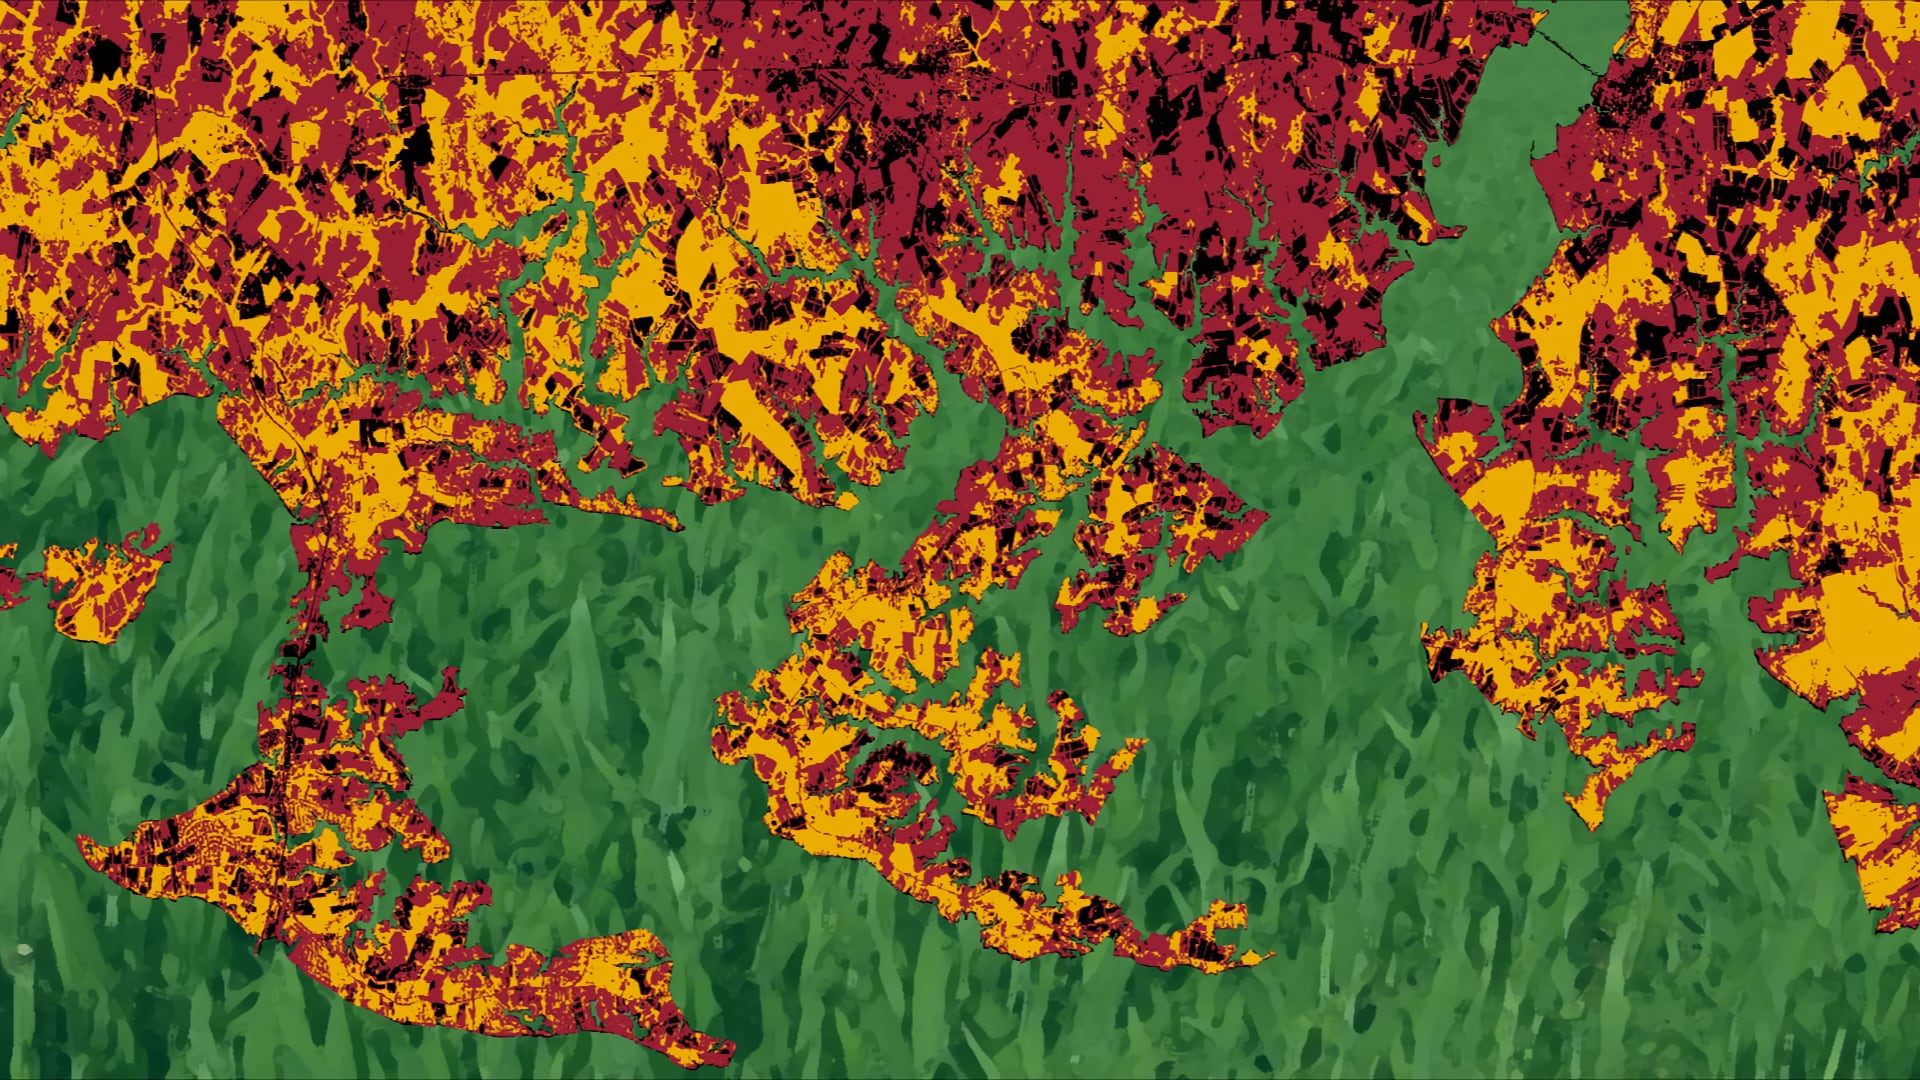
Cover crops enrich soils, limit erosion, and reduce nutrient runoff from agricultural land. To promote their usage, the Maryland Department of Agriculture (MDA) subsidizes farmers who plant winter cover crops. In order to maximize environmental benefits, cover crops must be terminated in the spring, rather than harvested. Previous DEVELOP collaborations with the MDA used imagery from Landsat 5 Thematic Mapper (TM), Landsat 8 Operational Land Imager (OLI), and Sentinel-2 MultiSpectral Instrument (MSI) to analyze various agronomic parameters which affect cover crop effectiveness. The Spring 2019 DEVELOP team continued to work with this imagery through Google Earth Engine and created a new application to remotely sense the presence of cover crops during the spring season. This tool, Cover Crop Remotely Observed Performance (CCROP3), aims to confirm that cover crops have been planted and verify the dates on which they were terminated, thereby reducing the need for the MDA to manually spot-check fields. The resulting graphical user interface (GUI) will also be used by the MDA to analyze parameters that influence cover crop effectiveness, such as cover crop type, planting date, and fertilizer usage. This GUI has the potential to promote more informed decision making and more effective conservation efforts for the Chesapeake Bay.
