Imagen
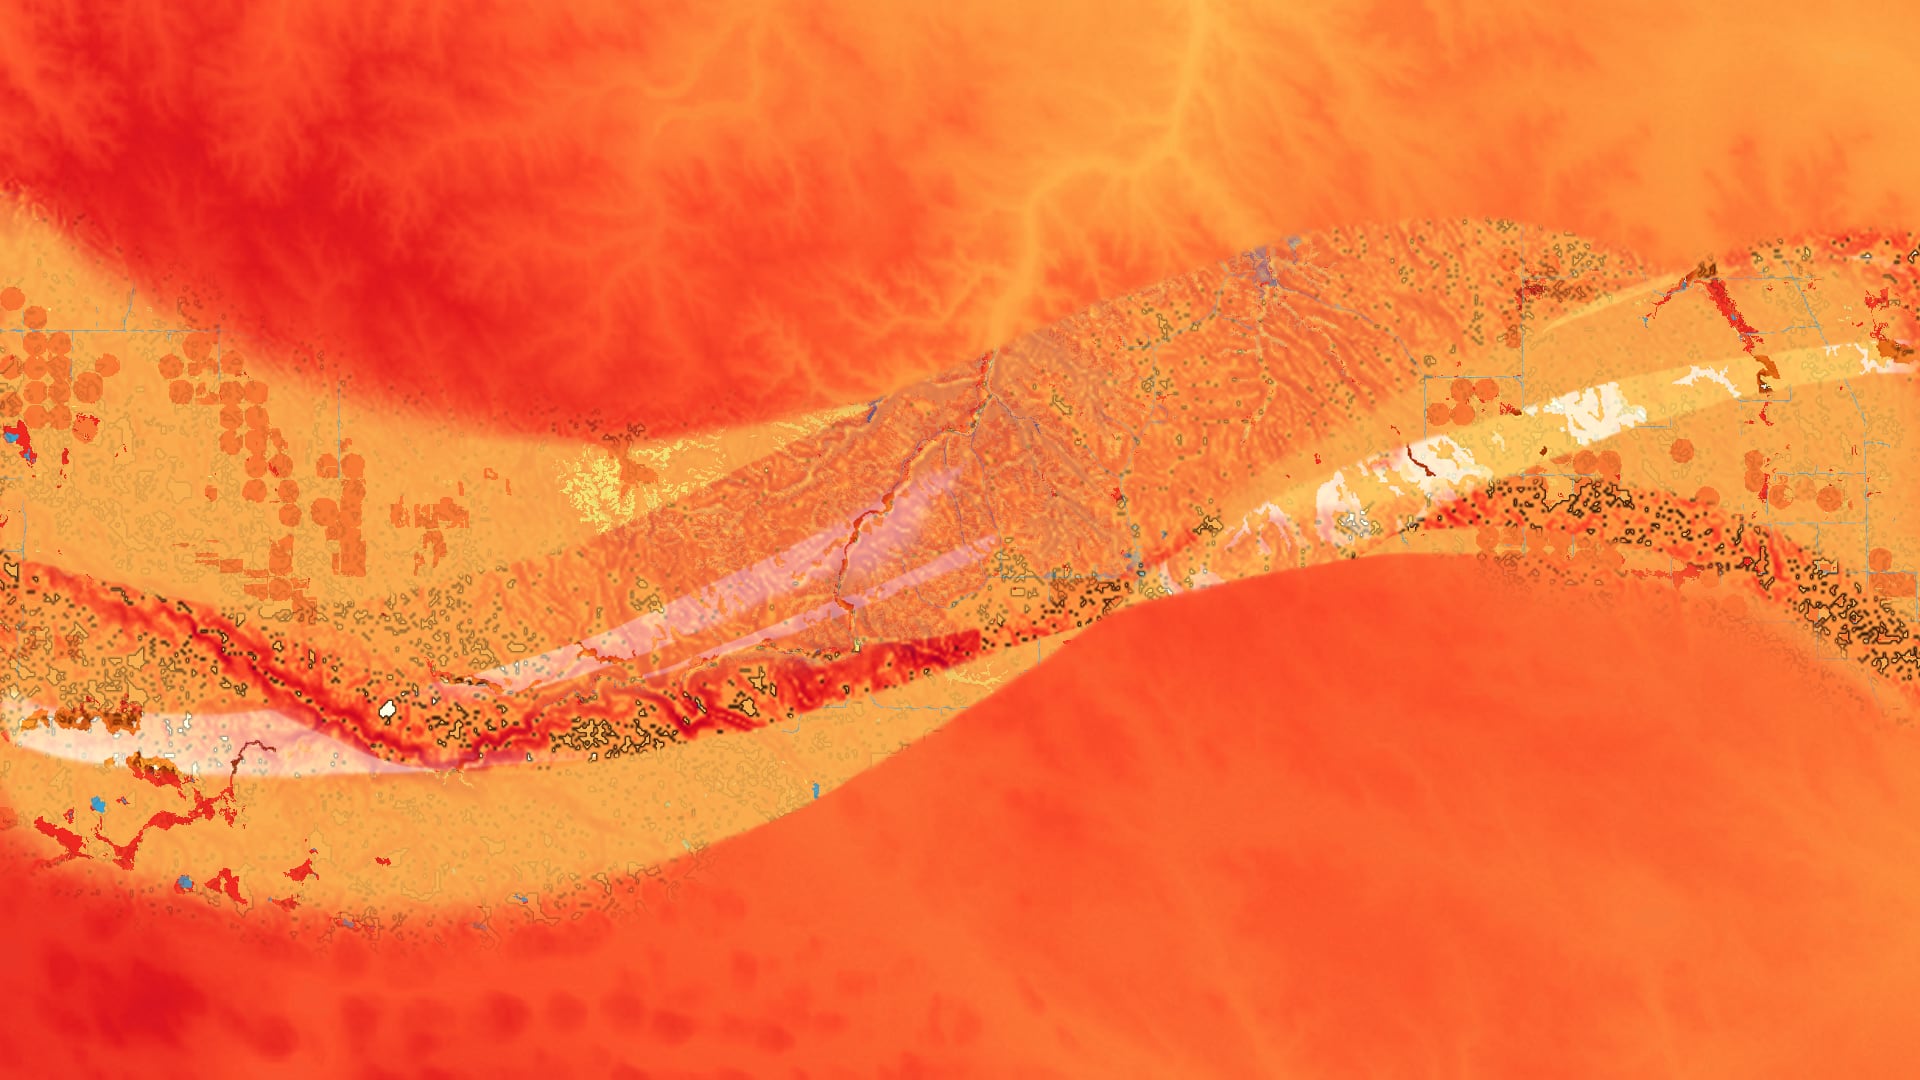
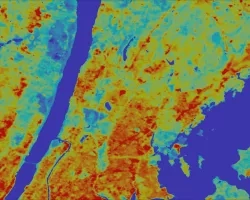
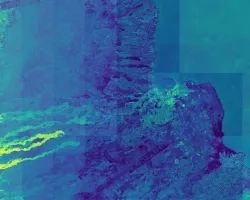
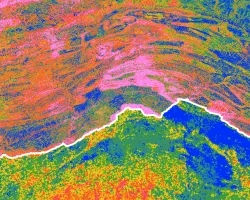
In 2019, the Great Plains experienced unprecedented catastrophic flooding. Large flood events are predicted to increase in frequency and severity, posing risks to communities in this region, particularly Tribal Nations. We used Sentinel-1 C-band Synthetic Aperture Radar (C-SAR), imagery from the Sentinel-2 MultiSpectral Instrument (MSI), and digital elevation models from the Shuttle Radar Topography Mission (SRTM) within Google Earth Engine to map historical floods in the region beginning in 2014 with particular attention to the Rosebud Sioux Reservation and the tribal lands of other Great Plains Tribal Water Alliance members. This historical mapping used C-SAR for a combined method approach with a Z-score algorithm in addition to an index for flooded short vegetation. We also developed a flood risk map by weighting different flood predictor variables according to flood risk literature. These variables included soil drainage from the Soil Survey Geographic Database (SSURGO); elevation, slope, and Topographic Wetness Index (TWI) derived from digital elevation models; precipitation from Climate Hazards Group InfraRed Precipitation with Station data (CHIRPS); land cover from the National Land Cover Database (NLDC); and Normalized Difference Vegetation Index (NDVI) derived from Landsat 8 Operational Land Imager (OLI). From the flood extent and risk maps, we identified widespread flooding in short vegetation (including cropland) and noted flood susceptibility in regions exhibiting high social vulnerability and low community resilience (FEMA indices). We created an ArcGIS Online StoryMap to share project background, results, and data. Additionally, we provided a written tutorial so partners may replicate the flood mapping for future flood events.