Share icon

Spatial and temporal variations in land surface temperature, vegetation and socioeconomic and health characteristics in frontline EEJ neighborhoods in New York City: Integrating Scientific Study with Community Perspectives

Team: Dr. Peter J. Marcotullio (Hunter College, CUNY), Dr. Andrew Reinmann (Advanced Science Research Center/Hunter College, CUNY), Dr. Mehdi Heris (Hunter College, CUNY). Janice Barnes (Adaptation Partners), Graduate students - Gowri Anand (Hunter College, CUNY) and Andrew Kittredge (Hunter College, CUNY)

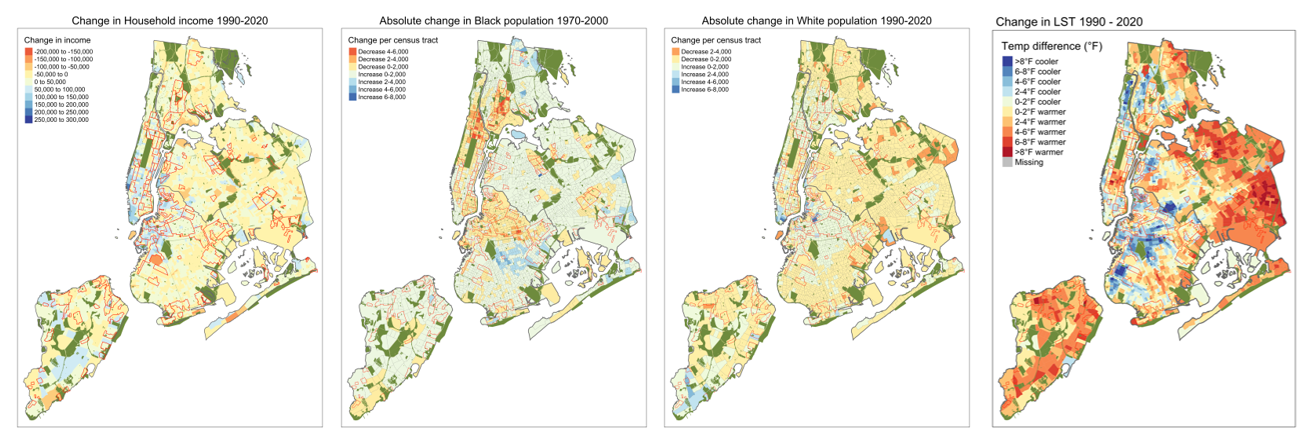
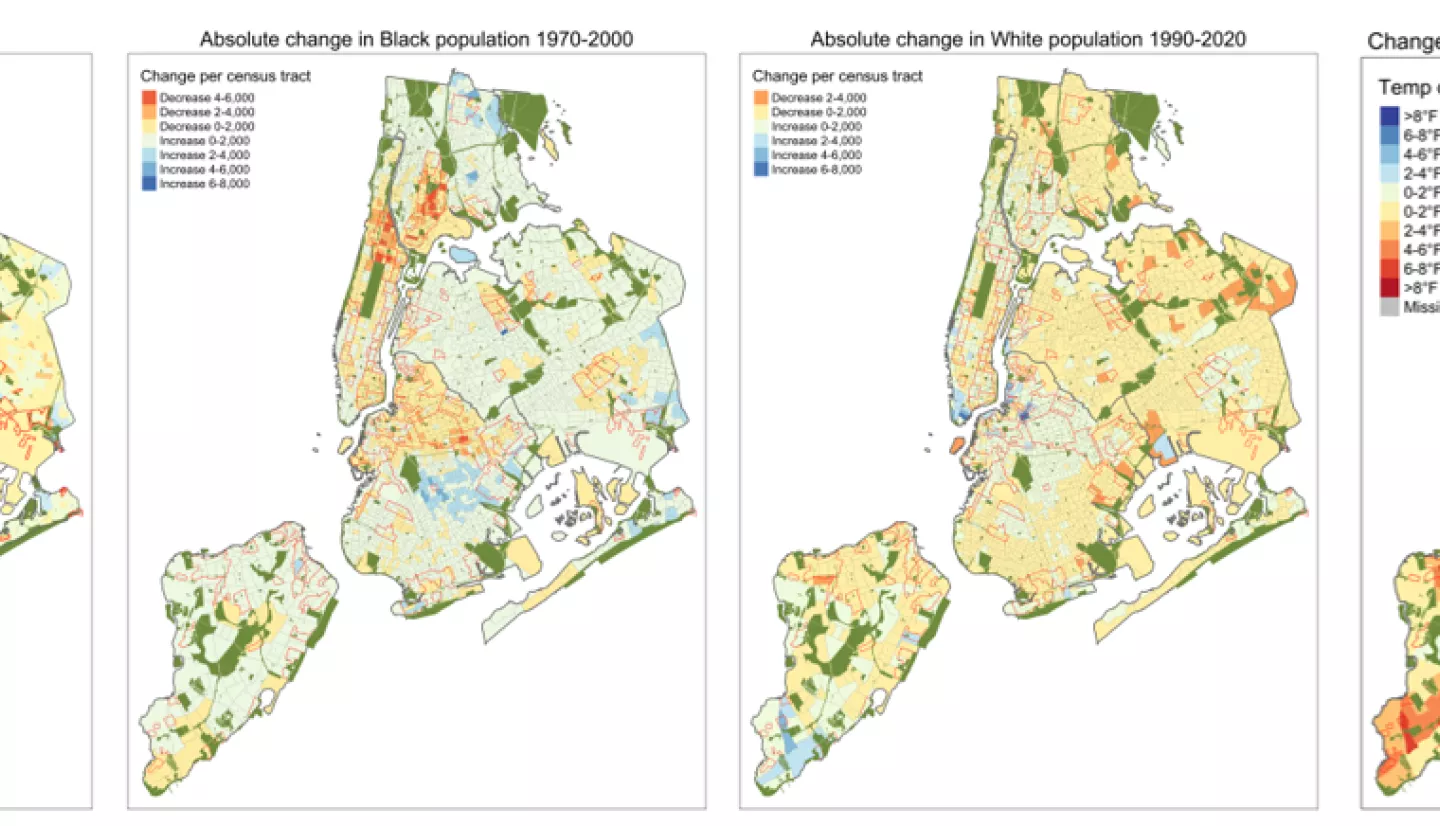
Executive Summary: This landscape project proposes a historical accounting of the relationship between land surface temperature (LST), normalized difference vegetation index (NDVI), greening and climate-related policies and socio-economic change in different neighborhoods in New York City. Neighborhoods are defined by the Home-Owners Loan Corporation (HOLC) distinctions at the census tract level in New York City. We will examine temporal and spatial relationships from 1984 to 2023 to associate changes in LST, greening and climate-related policies and socio-economic and health change in frontline equity and environmental justice (EEJ) neighborhoods. A major goal of the project is to identify the information useful for integrating community perspectives in the analysis.

This image presents changes in racial, income and land surface temperatures across HOLC redlined neighborhoods (thin red outlined areas) in New York City from 1990 to 2020.
This image presents changes in racial, income and land surface temperatures across HOLC redlined neighborhoods (thin red outlined areas) in New York City from 1990 to 2020. The maps demonstrate the shift in racial composition with decreases in the African American populations in Harlem, northern and downtown Brooklyn, LI City and Astoria Queens and the Lower East Side of Manhattan. At the same time, these areas experienced increases in the white population. Also important are the changes in income. The Median Household Income change was identified by subtracting the census tract level household income in 1990 from the census tract level household income in 2020, meaning that the influence of inflation was not removed. The final map, on the far right is the difference in land surface temperatures (LST) in the city (in Fahrenheit degrees). This map compares the summer time (June, July and August) mean LST per census tract from 1990 to 1994, with the mean summer LST per census tract from 2019 to 2021. These maps are preliminary. We will examine changes across a larger number of socio-economic variables, including the CDC’s SVI from 1980 to 2020, further aggregate LST by 10-year intervals (1985-1994, 1996-2004, 2005-2014, 2015-2023), include change in greening (NDVI) and some analysis of climate-related policies in our final analysis. The maps suggest locations of gentrification and displacement are associated with decreases in LST. In other locations, increased income and increases in the white population is associated with higher LST (parts of Staten Island). There are locations were the African American population increased as did LST (Eastern Queens). Finally, there are locations in Northern Manhattan and the Bronx were there were changes in LST that do not seem to be associated with the variables presented.