Imagen
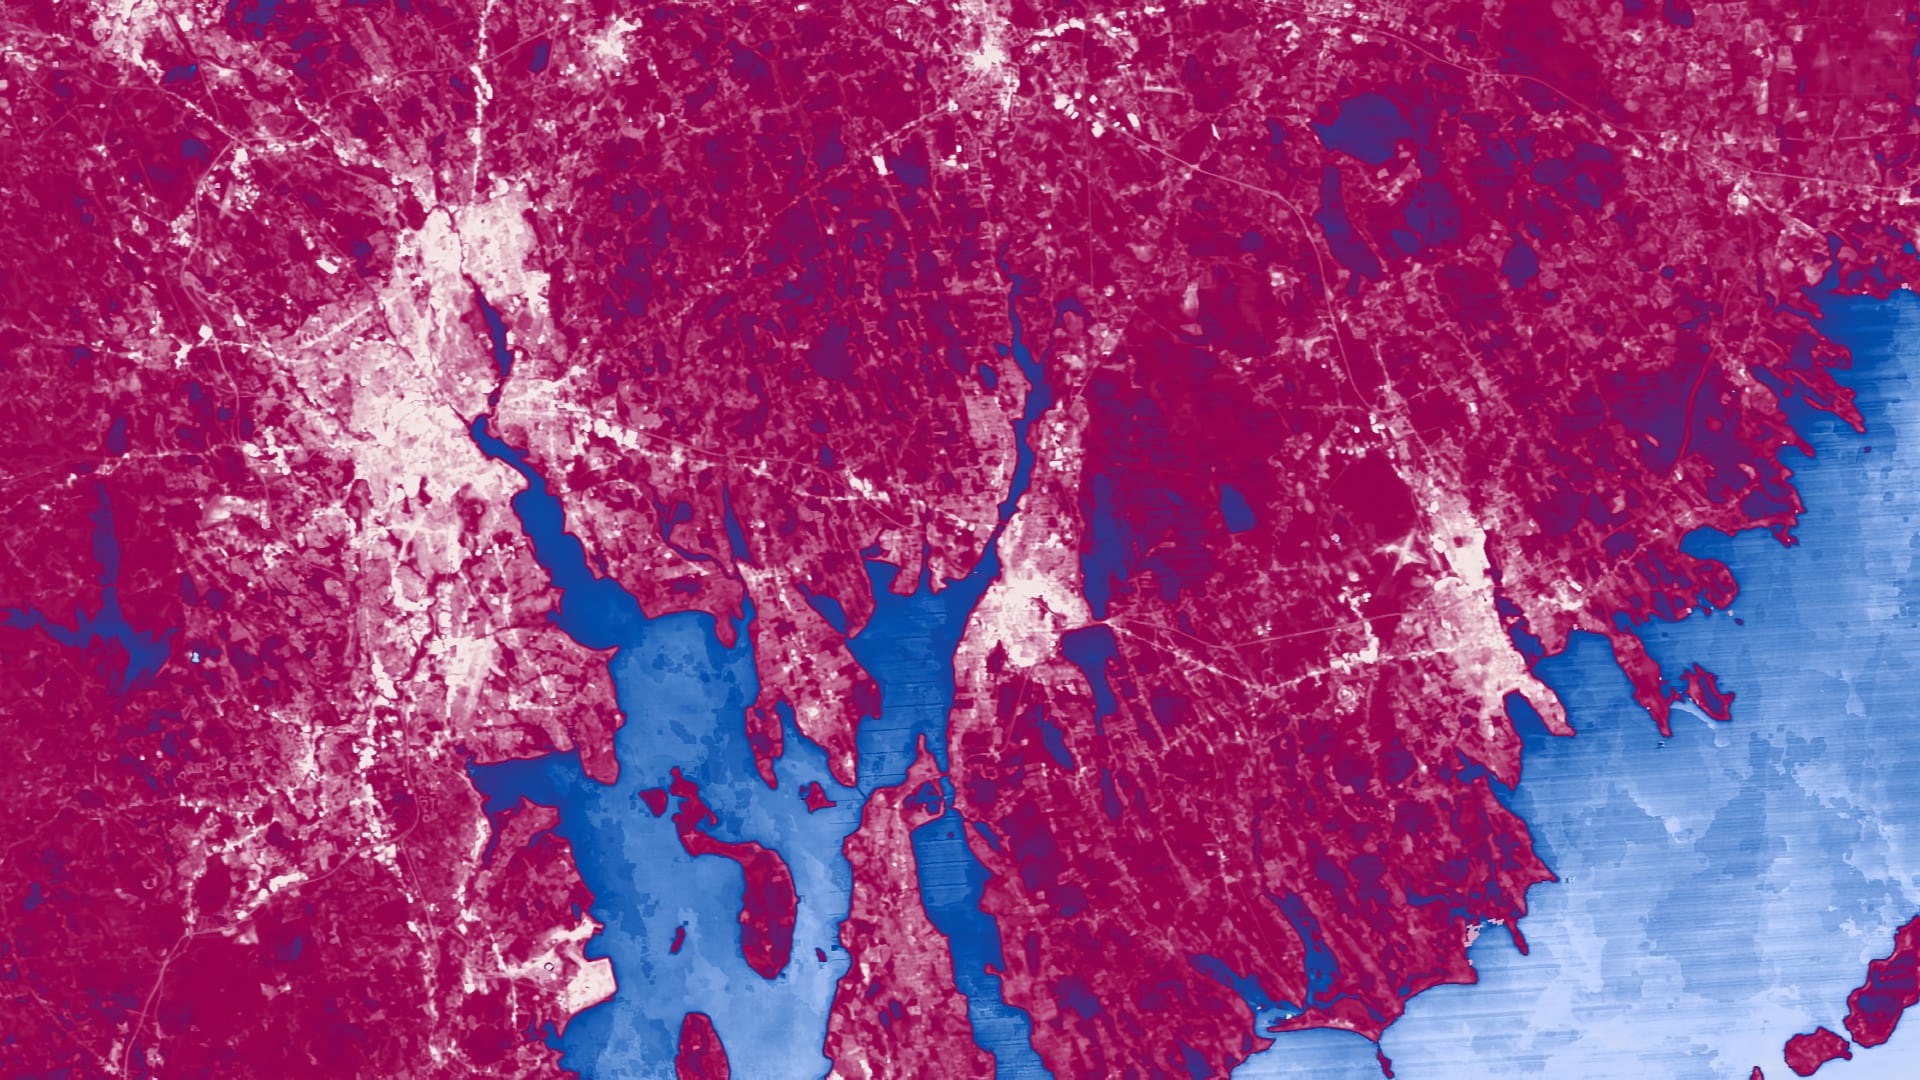
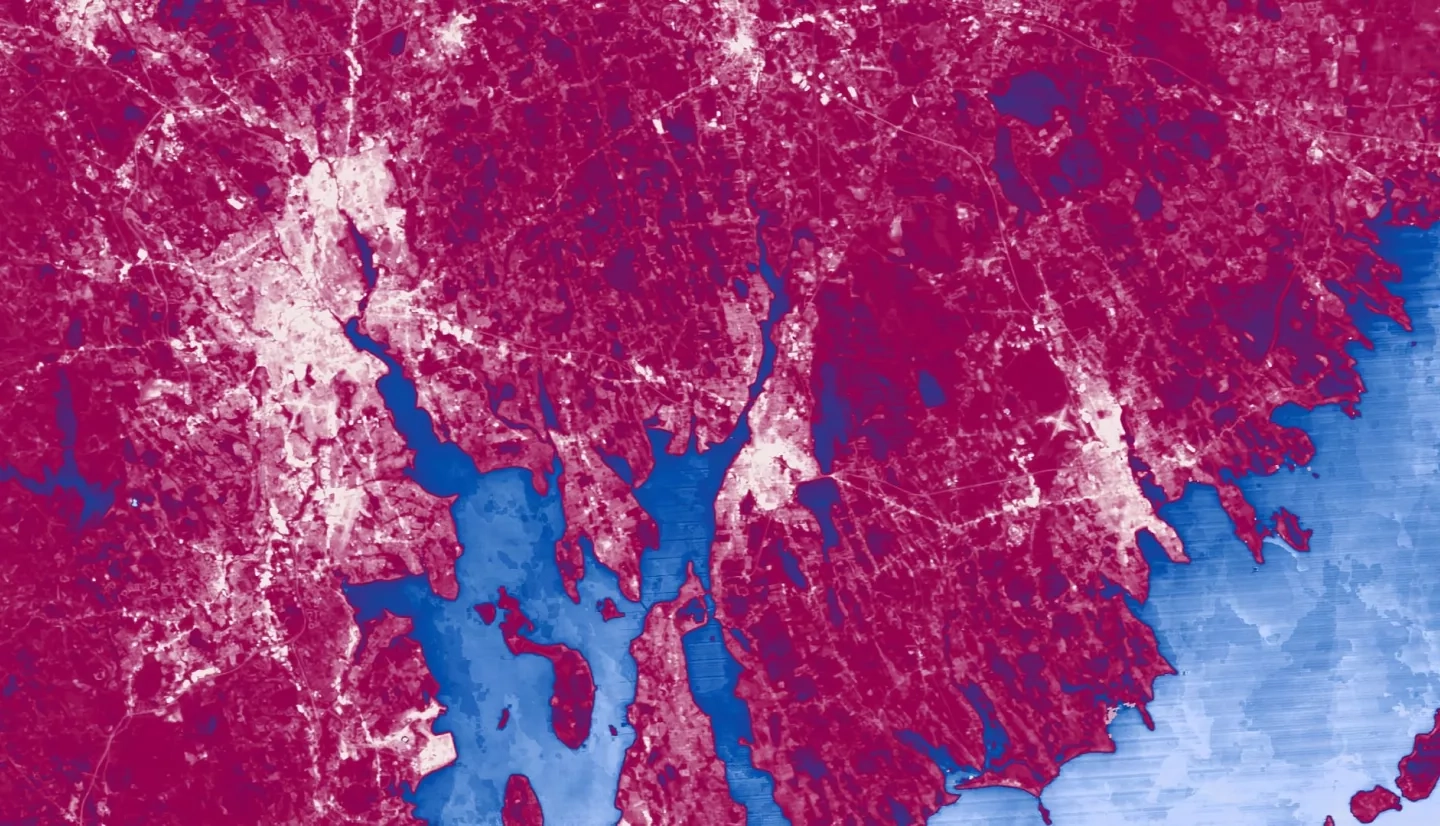
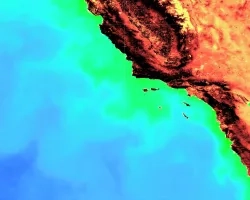
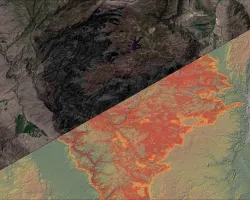
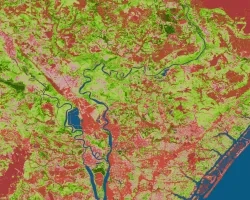
Coastal cities like Providence, RI, and Elizabeth, NJ, are directly affected by extreme heat and flooding events, which impacts the lives of community members. Groundwork USA is a community-based non-profit organization dedicated to increasing environmental resilience in urban communities. One of its initiatives, the Climate Safe Neighborhoods project, is aimed at assessing climate resiliency through the implementation of urban heat and flood mapping methodologies. This project used the Landsat Level-2 Provisional Surface Temperature product (STP), provided by the United States Geological Survey (USGS), to analyze land surface temperatures. The team cross-referenced the STP with both Terra Moderate Resolution Imaging Spectroradiometer (MODIS) and Advanced Spaceborne Thermal Emission and Reflection (ASTER) land surface temperature data for validation purposes. Similarities in the land surface temperature values from the three products proved that STP is a viable alternative to other previously established heat methodologies. The results of this analysis showed significantly higher temperatures in the highest urbanized areas. The flood distribution map analysis utilized surface reflectance data from Landsat 5, Landsat 7, and Landsat 8 over a 30-year time series. Normalized Difference Water Index (NDWI) and Modified Normalized Difference Water Index (MNDWI) were applied to the Landsat images to calculate and visualize annual and decadal flood frequency. This allowed for a robust methodology to analyze flood frequency over a 30-year time period and the analysis showed areas within both cities that had higher flooding frequency rates. The heat and flood assessment maps generated from this project will aid Groundwork USA in its resilience planning efforts and urban planning advocacy.