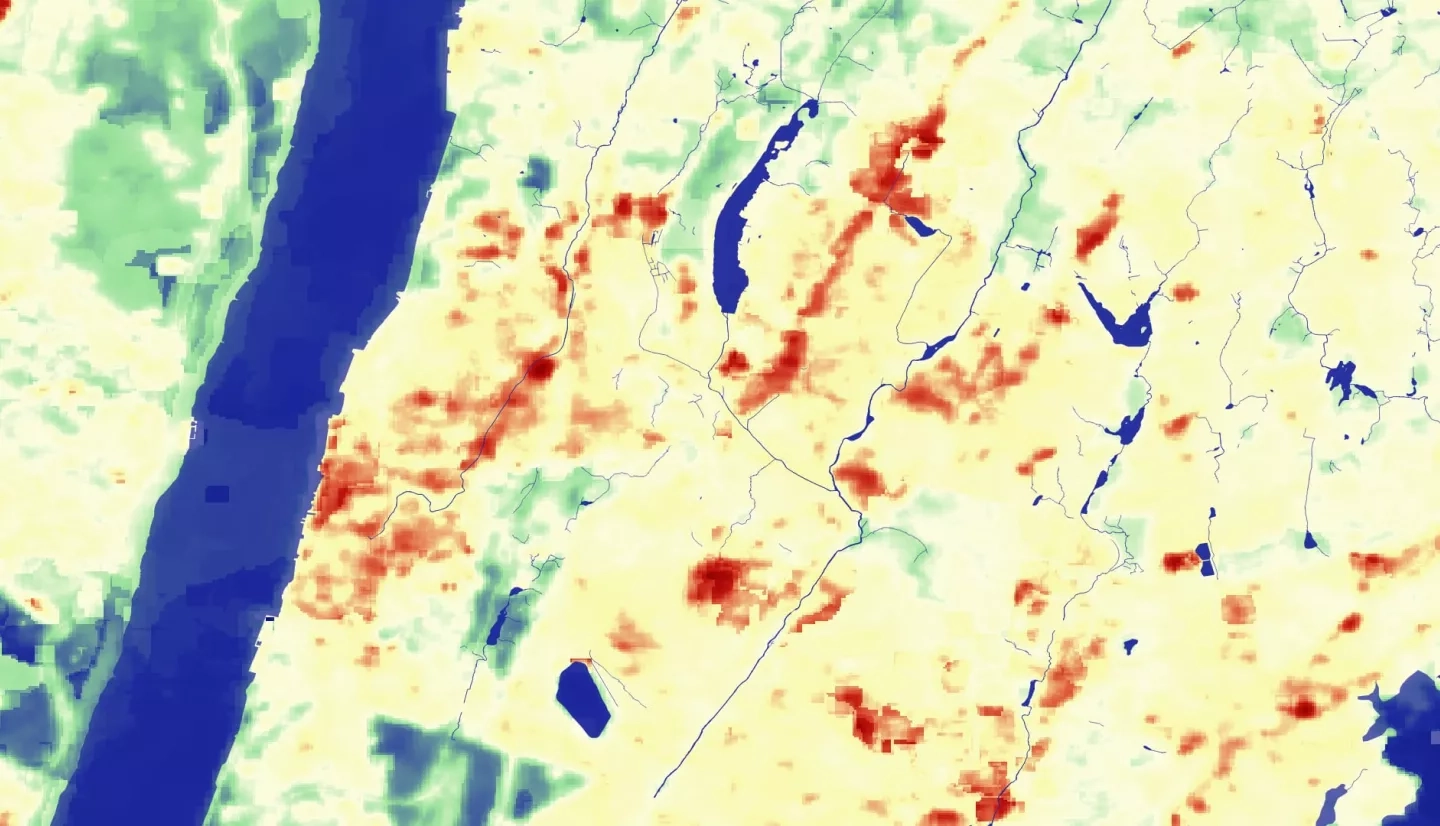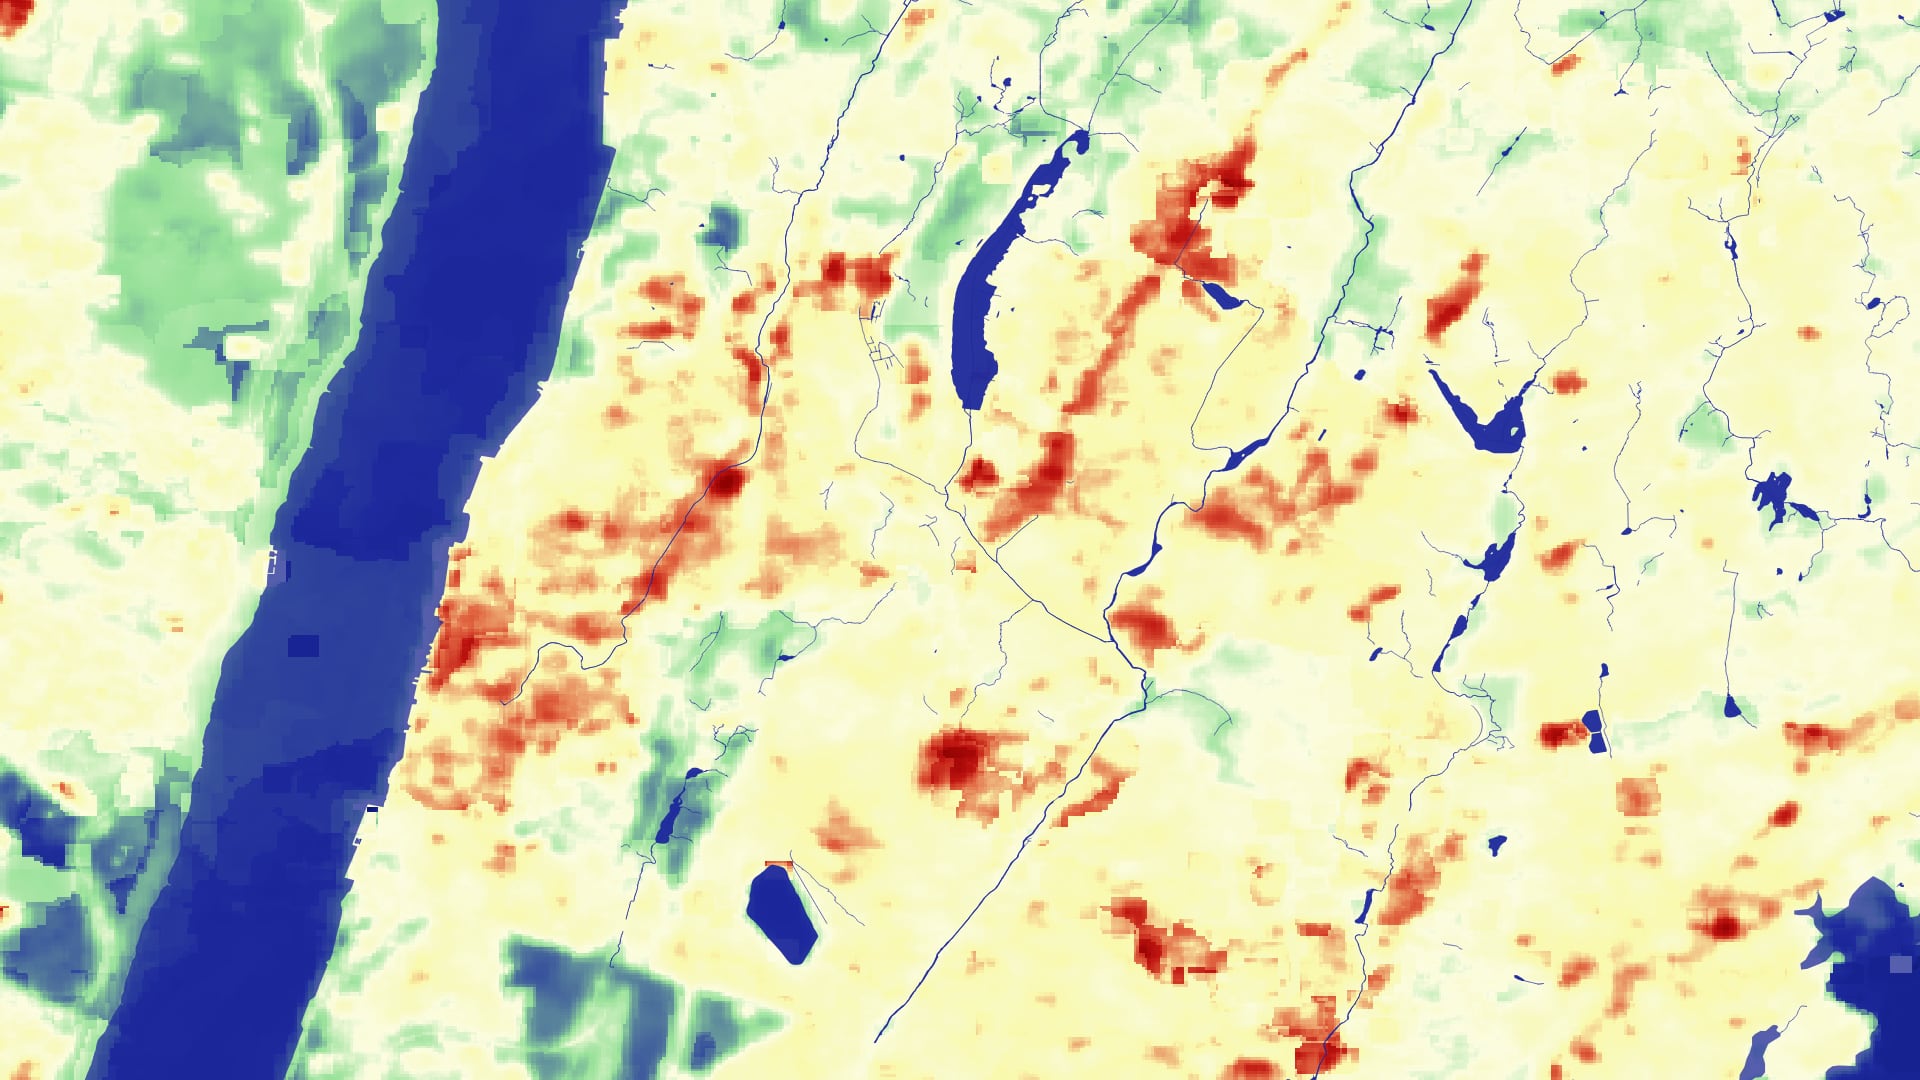
The City of Yonkers, New York, is located directly north of the Bronx in Westchester County and currently hosts a population of nearly 200,000. In response to increasing hot-weather episodes, the risk of heat-related illnesses and mortality is disproportionately affecting neighborhoods in Yonkers historically subjected to race-based housing segregation. NASA DEVELOP collaborated with Groundwork Hudson Valley to determine regions within Yonkers that are experiencing the most intense urban heat island effects, identify and rank sociodemographic and environmental determinants of increasing community-level vulnerability, map these vulnerabilities as a combined vulnerability index, complete a proximity analysis of walkability to local cooling centers and health facility locations, and model potential cooling strategies. The study area consisted of Yonkers, NY and the analyses used data from 2015-2020 (June through August). The project utilized NASA Earth observation products including Landsat 4 and 5 Thematic Mapper (TM), Landsat 7 Enhanced Thematic Mapper Plus (ETM+), Landsat 8 Operational Land Imager (OLI) and Thermal Infrared Sensor (TIRS), Terra Advanced Spaceborne Thermal Emission and Reflection Radiometer (ASTER), and ECOsystem Spaceborne Thermal Radiometer Experiment on Space Station (ECOSTRESS). We assessed the benefits of different heat-mitigation scenarios by utilizing the Integrated Valuation of Ecosystem Services and Tradeoffs (InVEST) urban cooling model. Results from these analyses can be used by Groundwork Hudson Valley, supporting the New York State’s Climate Safe Communities Certifiable Planning Actions, expanding knowledge on the relationship between historic redlining and environmental equity, and informing their Climate Safe Neighborhoods initiative to identify and prioritize mitigation efforts to abate the worst impacts of extreme heat.
