Displaying 11 - 20 of 23
![2022 Spring ARC California Agriculture Website Image](/sites/default/files/styles/lis/public/2022-06/2022Spring_ARC_CaliforniaAg_WebsiteImage_0.png.webp?itok=HB_A-rId)
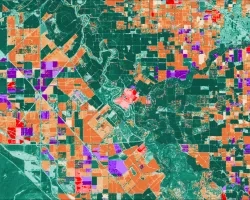
California Agriculture (Spring 2022) Team: Rachael Ross (Project Lead), Alex Posen, Shreya Suri, Stefanie Mendoza Summary: California seeks to become a carbon neutral state by...
![2022 Spring GA Haiti Agriculture Website Image](/sites/default/files/styles/lis/public/2022-06/2022Spring_GA_HaitiAgriculture_WebsiteImage.png.webp?itok=J9cVGC4L)
Haiti Agriculture (Spring 2022) Team: Kelli Roberts (Project Co-Lead), Taylor Simkins (Project Co-Lead), Ilan Bubb, Nohemi Huanca-Nunez Summary: Haiti is one of the world’s most...
![Median daily evapotranspiration (ET) from September 2021 to May 2022 calculated from ISS ECOSTRESS data. The image covers the agricultural fields adjacent to the Maipo River, Chile and depicts water stress. The color scale ranges from red (low ET) to blue (high ET), with higher ET observed over irrigated agricultural fields. ET is used for estimating crop irrigation requirements. This data will inform irrigation management practices and help alleviate water scarcity within the area. ](/sites/default/files/styles/lis/public/2022-11/2022Sum_PUP_MaipoRiverValleyAg_WebsiteImage.jpg.webp?itok=DiGPgMrj)
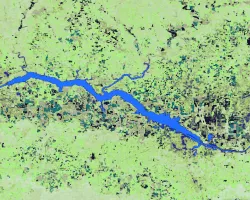
Maipo River Valley Agriculture (Summer 2022) Team: Benjamin Goffin (Project Lead), Duncan Srsic, Rishudh, Sarah Carlos Summary: Agriculture is the primary use of water in...
![Summer 2022 Haiti Agriculture II](/sites/default/files/styles/lis/public/2022-11/2022Sum_GA_HaitiAgII_WebsiteImage.jpg.webp?itok=6JVFyy8M)
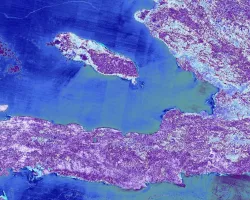
Haiti Agriculture II (Summer 2022) Team: Kelli Roberts (Project Lead), Justin Meyer, Rajneesh Sharma, Monique Howlett Summary: The Caribbean country of Haiti has an extensive...
![Summer 2022 Chesapeake Bay Agriculture](/sites/default/files/styles/lis/public/2022-11/2022Sum_GFSC_ChesapeakeAg_WebImage_V2.jpg.webp?itok=oalM5vib)
Chesapeake Bay Agriculture (Summer 2022) Team: Alexia Hernandez (Project Lead), Clay Hays, Arina Morozova, Matthew Borden Summary: The Chesapeake Bay boasts some of the nation’s...
![False-color imagery from Landsat 8 surface reflectance. The 2021 median composite image depicts the landscape and vegetation sites in the regions of western Bhutan, specifically the districts of Punakha, Wangdue Phodrang, Thimphu, and Paro. The band combination highlights fallow agriculture fields in light brown, dense urban areas in purple, forest cover in green, snow in light blue, and rocky areas in darker brown.](/sites/default/files/styles/lis/public/2022-12/2022Sum_MSFC_BhutanAgII_WebsiteImage.png.webp?itok=T2Ky1XPH)
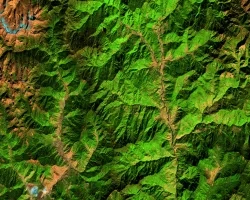
Bhutan Agriculture II (Summer 2022) Team: Wangdrak Dorji (Project Co-Lead), Tenzin Wangmo (Project Co-Lead), Karma Dorjee, Sonam S Tshering Summary: Agriculture is an essential sector...
![NDVI over Mato Grosso, Brazil processed from March 2021 Landsat-8 OLI data. Calculated NDVI values correspond with colors shown to indicate plant health. High NDVI values (green to blue) indicate dense vegetation found in tropical and temperate forests or crops at their peak growth. Low values (yellow to red) depict barren land, water, and moisture-stressed vegetation. These data can support timely and efficient agricultural responses to ensure productive yields and food security.](/sites/default/files/styles/lis/public/2022-12/2022Sum_NC_MatoGrosso_WebsiteImage_FD.png.webp?itok=JJA3kKJi)
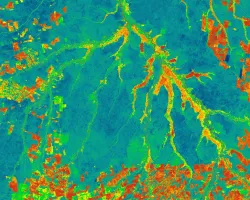
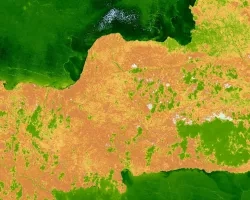
Mato Grosso Agriculture (Summer 2022) Team: Max Rock (Project Lead), Elijah Dalton, Aidan Harvey, Kate Reynolds Summary: Ranked as the fourth largest food producer in...
![Annual max biomass calculated from 2021 daily Harmonized LandSat Sentinel-2 (HLS) dataset. Dark purple colors show low biomass while the bright orange show high biomass. Regions with high vegetation and tree canopy cover are shown in orange on the left of the image. High biomass values are of an interest to rangeland managers to help inform their grazing decisions based on which areas of the ranch produce the most biomass/vegetation.](/sites/default/files/styles/lis/public/2023-02/2022Fall_CO_EasternPlainsAgr_WebsiteImage.jpg.webp?itok=StO3rYYa)
Eastern Plains Agriculture (Fall 2022) Team: Jillian Joubert, Sarah Hettema, Deni Ranguelova, TR Ingram, Max Stewart Summary: Adaptive management on cattle ranches requires rangeland managers...
![Snow persistence data were processed into snow zones from Terra MODIS 500m resolution data from 2001-2020. 2021 30m resolution rangeland biomass data from the RPMS website. RPMS data (brown and black) are derived from Landsat 5 TM, 7 ETM+, 8 OLI, and 9 OLI-2. The image displays snow persistence zones, with intermittent, transitional, and persistent snow zones in orange, light blue, and dark blue respectively. The image includes parts of the Sawatch and Elk Mountains.](/sites/default/files/styles/lis/public/2023-05/2023Spring_CO_WesternSlopeAg_Website_image.jpg.webp?itok=A7yts3_b)
Topic
Southern Rockies Western Slope Agriculture (2023 Spring) Team: Adelaide Gonzalez (Project Lead), Rachel Buchler, Max VanArnam, Stephanie Willsey Summary: Over the last decade, the southern...
![The data for this image comes from NASA satellite Landsat 8 Operational Land Imager. Normalized Difference Vegetation Index and Cropland Data Layers were used to create the image. The black, brown, and bright green specks represent the different crops growing near Wheeler Lake Watershed in North Alabama. NDVI and cropland data can be used to predict and evaluate the effects of flash drought on agricultural crops.](/sites/default/files/styles/lis/public/2023-05/2023Spring_MSFC_SoutheastUSAg_WebsiteImage.jpg.webp?itok=zZsHeQGk)
Topic
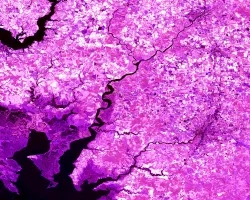
Southeast US Agriculture (2023 Spring) Team: Kindrea Gibbons (Project Lead), Michaela Gooch, Quinton Deppert, Casey Mills Summary: A flash drought refers to the rapid onset...