Principal Investigator

Gina Cova

Imagen
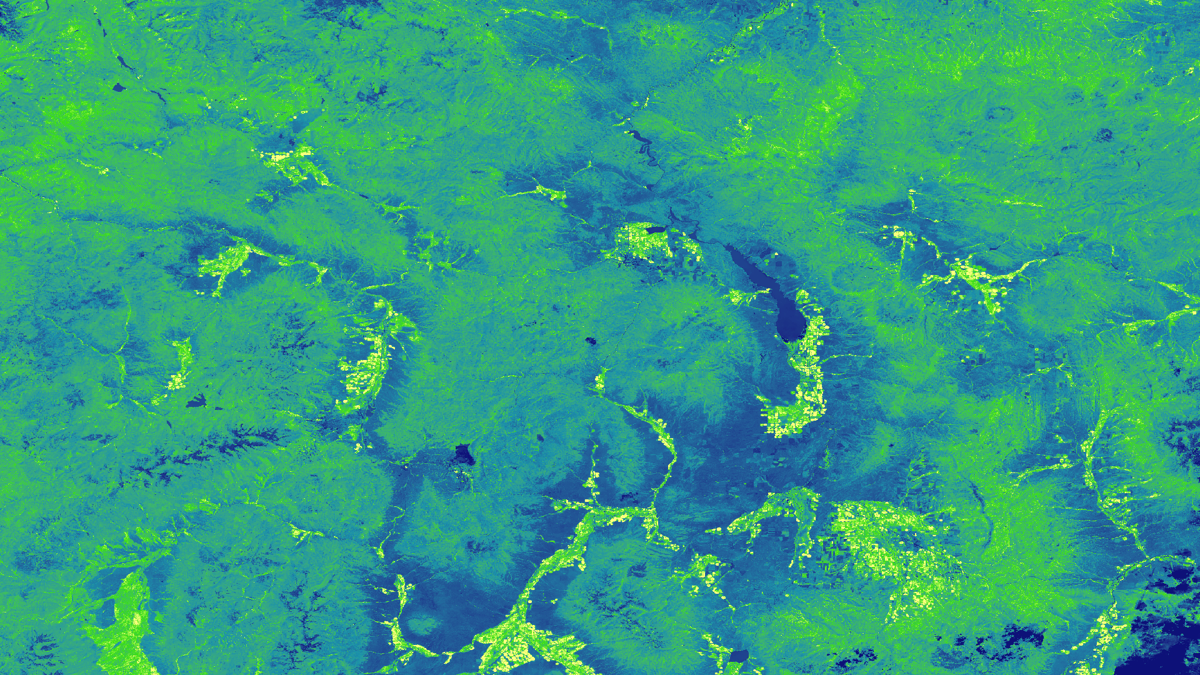
Tasseled cap angle transformation applied to 2018 Landsat 8 OLI imagery. Coal mines in the Powder River Basin of Wyoming are displayed. Lighter shades of blue indicate a higher ratio of barren land to vegetation and darker shades indicate a lower ratio of barren land to vegetation. End users can use this transformation as a proxy for identifying how barren, mined lands change over time.

Coal mines in the Powder River Basin of Wyoming account for approximately 41 percent of coal production in the United States, causing significant land disturbances. Without proper reclamation practices, orphan mines create barren, unstable lands unlikely to recover. Where mines have been successfully...

Principal Investigator

Gia Mancini

Imagen
Monitoring Mosquito Abundance and Distribution to Assist Vector-Borne Disease Management in Western Europe

Vector-borne diseases, caused by pathogens and parasites, are transmitted through living organism carriers known as vectors. Mosquitoes, the most common disease vectors, transmit illnesses such as Zika, West Nile, chikungunya, malaria, dengue, and yellow fever, which affect millions of people across the world and kill...

Principal Investigator

Christopher Tsz Hin Choi

Imagen
NDVI processed imagery using 2020 Landsat 8 OLI data blended with 2000 SRTM topography and derived hillshade data. The color scale represents a combination of topography and vegetation health in the Cameron Peak region of northern Colorado. The brown burn scar shows the progression of the Cameron Peak fire and areas with the highest ecological impact. In late 2020, this fire became the largest wildfire in Colorado’s recorded history.  Keywords: Cameron Peak Fire, invasive species, cheatgrass, ecological forecasting, wildfire, Colorado, Christopher Tsz Hin Choi, Alex Posen, Alix Bakke, Monika Rock, Nikole Vannest

Cheatgrass (Bromus tectorum) is a species of concern across the western United States as it has the potential to outcompete native plant species, reduce biodiversity, and diminish nutrient availability for ungulates. Furthermore, because cheatgrass can quickly dominate disturbed...

Principal Investigator

Chet Warren

Imagen
Monitoring Regional Air Quality to Address Air Pollution in National Parks through the Application of NASA Earth Observations

Good air quality is critical for the Intermountain Region of the National Park Service (NPS) to uphold legal mandates, such as the Clean Air Act, to protect park visitor health, the ecological health of the park flora and fauna, and the preservation of the vistas...

Principal Investigator

Rainey Aberle

Imagen
Utilizing 2020 Landsat 8 OLI imagery to monitor stock ponds over the Kaibab National Forest, Arizona: MNDWI and AWEI were calculated for inputs in a K-means clustering algorithm, the green, purple, and blue pixels from left to right represent the MNDWI, AWEI, and the K-means clustering algorithm's ability to automatically detect and delineate water. This product will aid the community in making more timely and low-cost land and livestock management decisions.  Keywords: Stock Ponds, Water-Extent Monitoring, Remote Sensing, Landsat 8 OLI

Due to increasingly frequent and severe drought conditions in the southwestern US, land managers and livestock producers need to monitor stock ponds with increasing regularity. The ability to assess stock pond water levels with Earth observing satellite systems would enhance...

Principal Investigator

Genevieve Clow

Imagen
Normalized Difference Water Index (NDWI) derived from a Landsat 8 OLI composite image, using data from September to November 2018. Water is shown in blue, and the driest regions are in pink. This image displays the man-made mining pools in northern Chile’s Atacama Desert. Looking at how NDWI has changed over time will increase understanding of mining impacts and assist in water resource management.

Saline systems, consisting of salt flats, ponds, and marshes, provide vital water resources to northern Chile’s Atacama Desert, one of the driest regions in the world. Mining is extensive in the Atacama, which contains 30% of the world’s lithium reserves and...

Principal Investigator

Arev Markarian

Imagen
Terrestrial NDVI change map of West Maui, Hawai’i, using a Landsat 4/5 TM composite (1989, 1990, 1991) and Landsat 8 OLI composite (2017, 2018), joined with a false-color marine turbidity image from February 10th, 2014, Landsat 8 OLI data.  On land, light shades indicate NDVI decreases while darker shades show NDVI increases. In the water, brown denotes high turbidity. Better understanding the trends in land use and water quality will help partners develop watershed management plans.  Keywords: Landsat 4 and 5 TM, Landsat 8 OLI, NDVI, Turbidity, LULCC, Watershed

West Maui is at risk of losing ecosystem services provided by coral reefs due to land-based sources of pollution (LBSP). In 2011, The US Coral Reef Task Force (USCRTF) identified Wahikuli, Honokōwai, Kahana, Honokahua, and Honolua as priority watersheds in...

Principal Investigator

Brooke Adams

Imagen
Monitoring the Spread of Invasive Grasses and the Impacts on Grassland Management Practices in the Great Plains Using NASA Earth Observations and NOAA Climate Data Records

Invasive grass species, specifically B. tectorum (cheatgrass), B. japonicus (japanese brome), and Melilotus (sweet clover), have expanded out of the Great Basin and into the western Great Plains of the United States. Increased development and land use in western South Dakota have provided a gateway...

Principal Investigator

Madison Murphy

Imagen
Monitoring the Urban Heat Island Effect on the Health of Residents in the New Orleans, Louisiana Metropolitan Area with Landsat and MODIS Land Surface Temperature Products

The urban heat island (UHI) effect occurs when non-vegetated surfaces trap heat during daylight hours, increasing the overall temperature of urbanized cities relative to adjacent rural areas. Excessive heat can increase the likelihood of heat stroke or dehydration, especially in vulnerable populations without access to...

Principal Investigator

Benjamin Rocha

Imagen
Diffuse Light Attenuation Coefficient (Kd(490)) processed image utilizing 2020 Landsat 8 OLI remote sensing data, showcasing turbidity within Port Everglades. Port Everglades is located along the Eastern Coast of Florida, south of Fort Lauderdale. Darker shades of blue represent lower levels of Kd(490), implying clearer, and generally healthier, water. Brown and orange represent high levels of Kd(490), generally indicating cloudier water conditions, which pose a threat to coral and coral reef health.  Keywords: Kd(490), Landsat 8 OLI, Coral, Port, Florida

The U.S. Army Corps of Engineers (USACE) and National Oceanic and Atmospheric Administration (NOAA) National Marine Fisheries Service (NMFS) will be supervising a harbor deepening project in Port Everglades, Florida. The project raises concerns about potential impacts on the nearby...