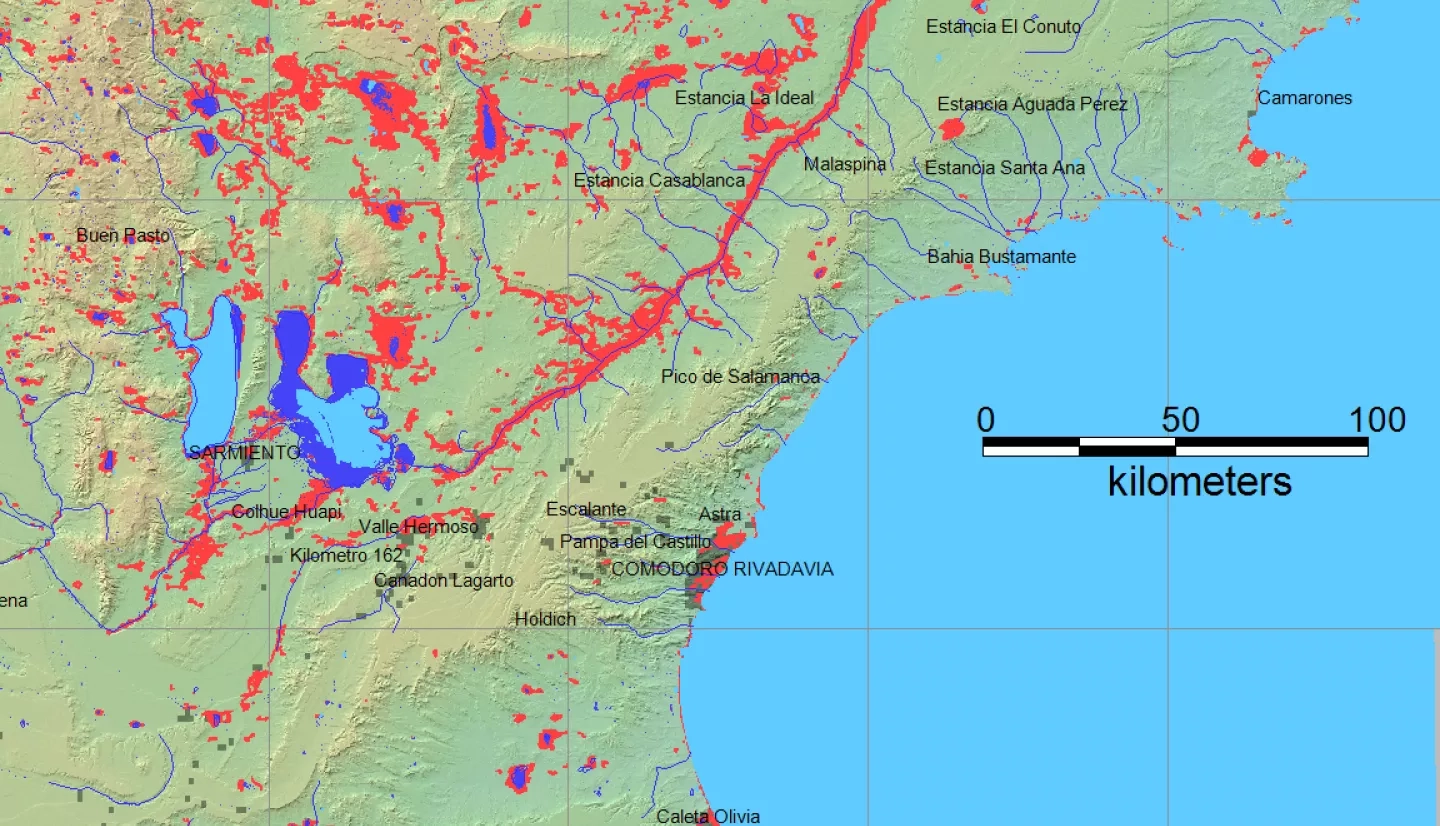
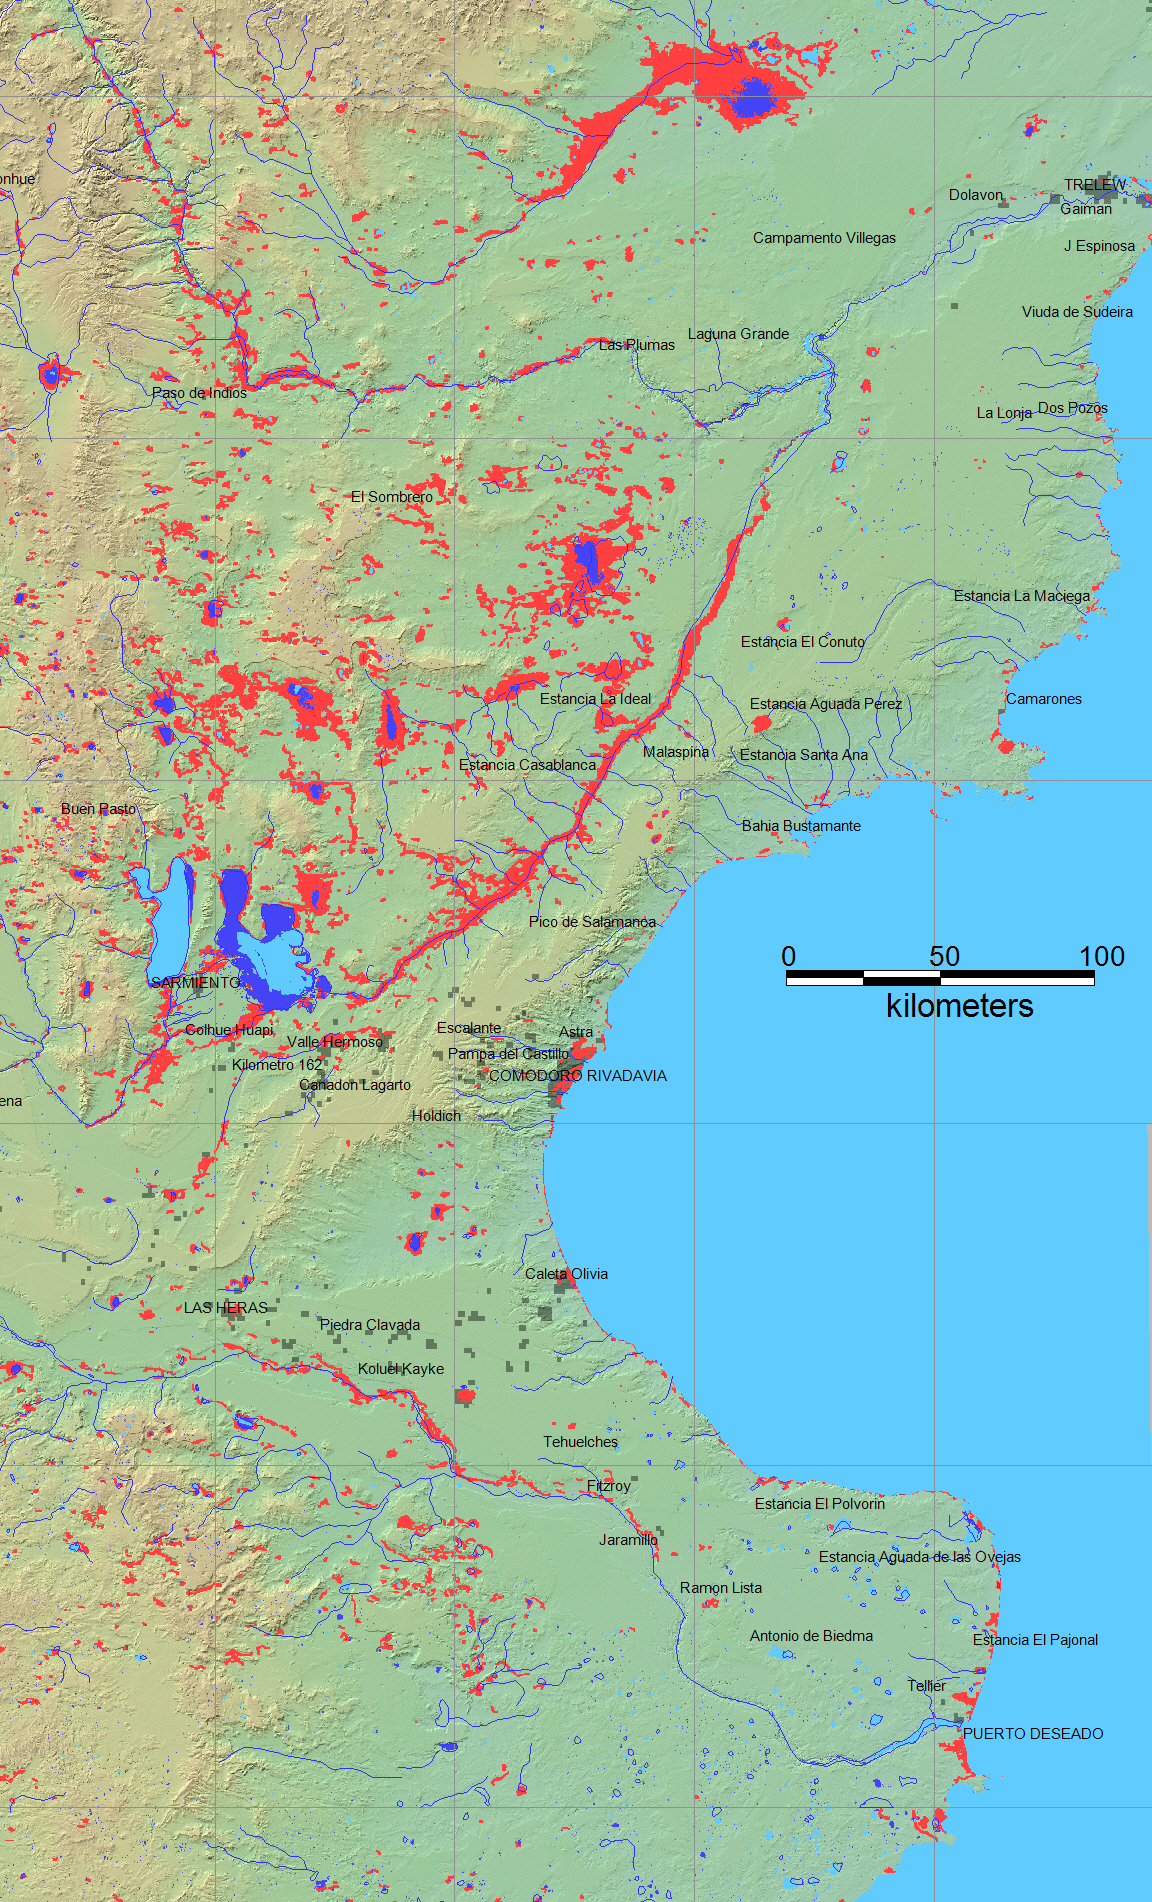
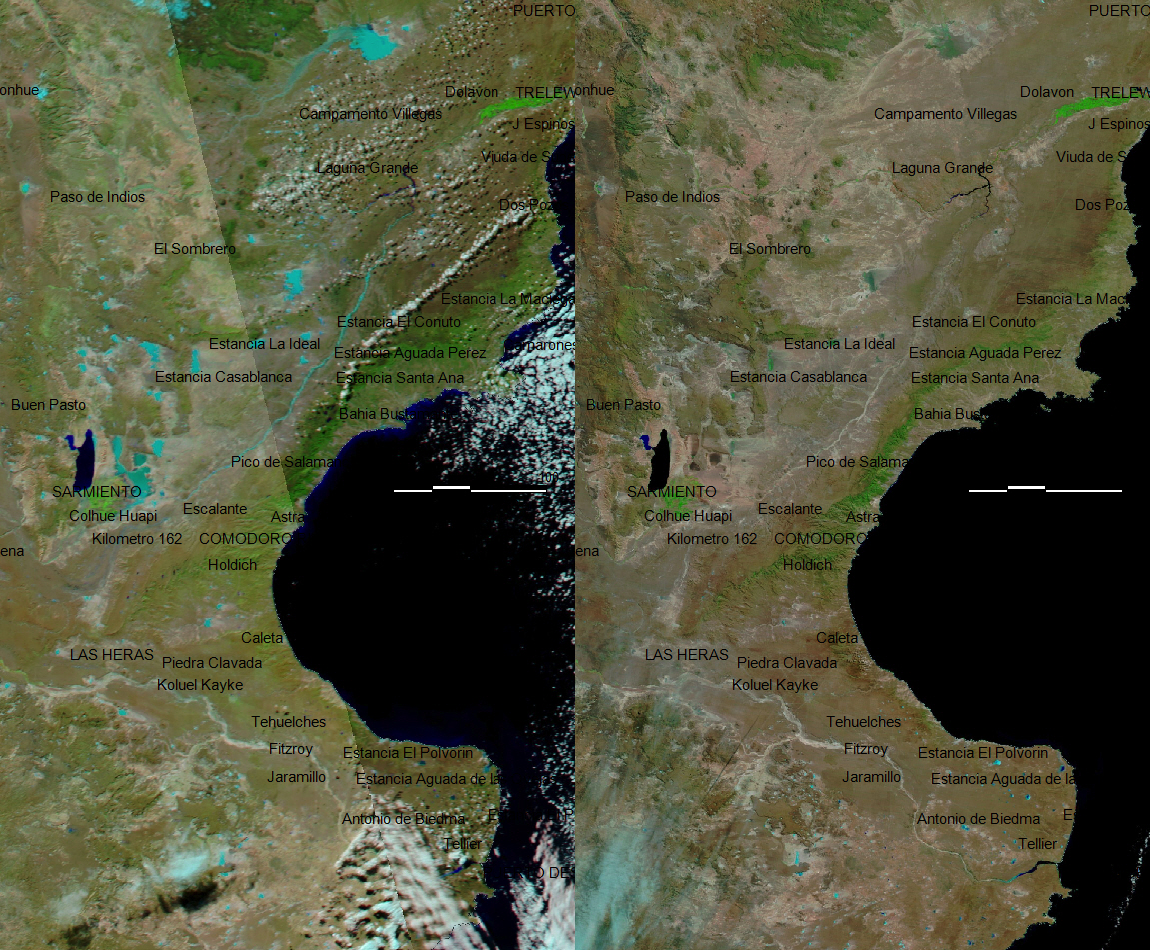
This is a draft map using two (Terra and Aqua) NASA MODIS WorldView scenes from April 11, 2017. Water was classified using an "isodata" unsupervised classification method (7-17 classes, three iterations, three classes were combined into one "water" class). A before scene is shown above for comparison purposes, but no change detection approach has been used so far. There are abundant "false water" areas shown; this map will be revised to remove these errors. Data processing of Sentinel 1 SAR scenes is in progress. Many rivers in this dry region of the Pampas are ephemeral and ofter without surface flow (see view from MODIS obtained prior to the flooding).
Layers, top to bottom: Light Blue is reference water extent mapped via NASA 90 m (spatial resolution) SWBD. Red is flood water mapped from ESA Sentinel 1 SAR data. Dark Blue is all previous satellite-mapped flooding. If visible, straight red markings define limit of satellite coverage. Urban areas (satellite visible lights) are shown in light gray.
MODIS WorldView bands 7,2,1 color composites, April 11, 2017 (flooding, left), and March 13, 1017 (pre-flood, right)
Image Data Sources:
NASA Landsat 8 and ESA Sentinel SAR data if used in this map were obtained from the the U.S. Geological Survey Hazards Data Distribution System. and the Sentinels Science Data hub, respectively. Landsat 8 is jointly managed by NASA and the United States Geological Survey. Flood modeling results if used are from the NASA/University of Maryland Global Flood Monitoring System (GFMS), Drs. Robert Adler and Huan Wu, University of Maryland/ESSIC.
GIS Data Sources:
Access GIS files supporting this Flood Event Map.
Access the automated daily MODIS-derived .shp file GIS record (record commences in 2011).
(Choose appropriate 10 deg x 10 deg map sheet directory and appropriate dates; longitude and latitudes refer to upper left map sheet corner; not all floods are mappable at the MODIS spatial resolution of 250 m)
Data from the Global Surface Water Explorer (a download data link is provided) is included as part the (dark blue) surface water layer. It is based on Landsat data at a spatial resolution of 30 m (Jean-Francois Pekel, Andrew Cottam, Noel Gorelick, Alan S. Belward, High-resolution mapping of global surface water and its long-term changes. Nature 540, 418-422, 2016). On the map, it is shown together with the NASA Shuttle Water Boundary Data (SWBD) surface water extent (90 m resolution) processed from the 11-day February, 2000, SRTM mission and corrected using Landsat data. Large flood events are not normally depicted in either data set. Thus, red areas on our maps show flood extent beyond these more typical water extents.
When used, NASA NRT Global Flood Mapping maximum water extent for the years 2013-2015, at 250 m spatial resolution, provide part of the (dark blue) maximum flood mapped. DFO creates these annual water extent layers from data provided by that project, by accumulating into one annual file all of the daily .shp files for each year. DFO has also produced flood extent files through mapping of individual floods (~ yr 2000 to present); these are also included where available in this maximum flood extent layer.