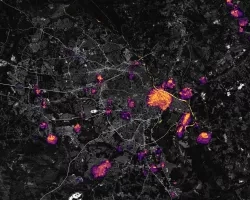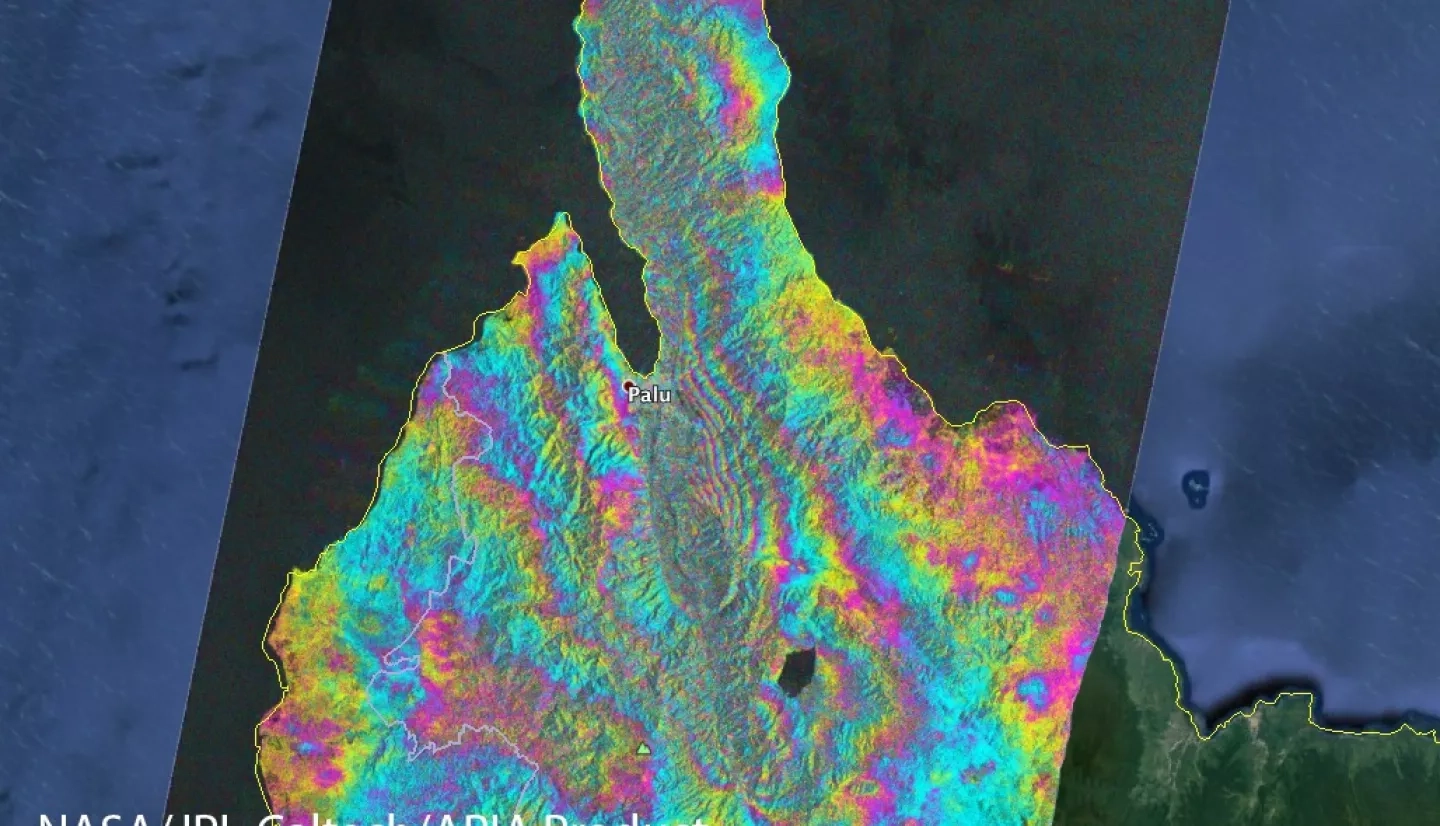
The Advanced Rapid Imaging and Analysis (ARIA) team at NASA's Jet Propulsion Laboratory and Caltech in Pasadena, CA created this false-color map showing deformation in Central Sulawesi, Indonesia, including the city of Palu, as a result of the Magnitude 7.5 earthquake on September 28, 2018. The map is derived from synthetic aperture radar (SAR) images from the ALOS-2 satellite, operated by Japan Aerospace Exploration Agency (JAXA). The images were taken before the earthquake on September 27, 2018 and after the earthquake on October 11, 2018.
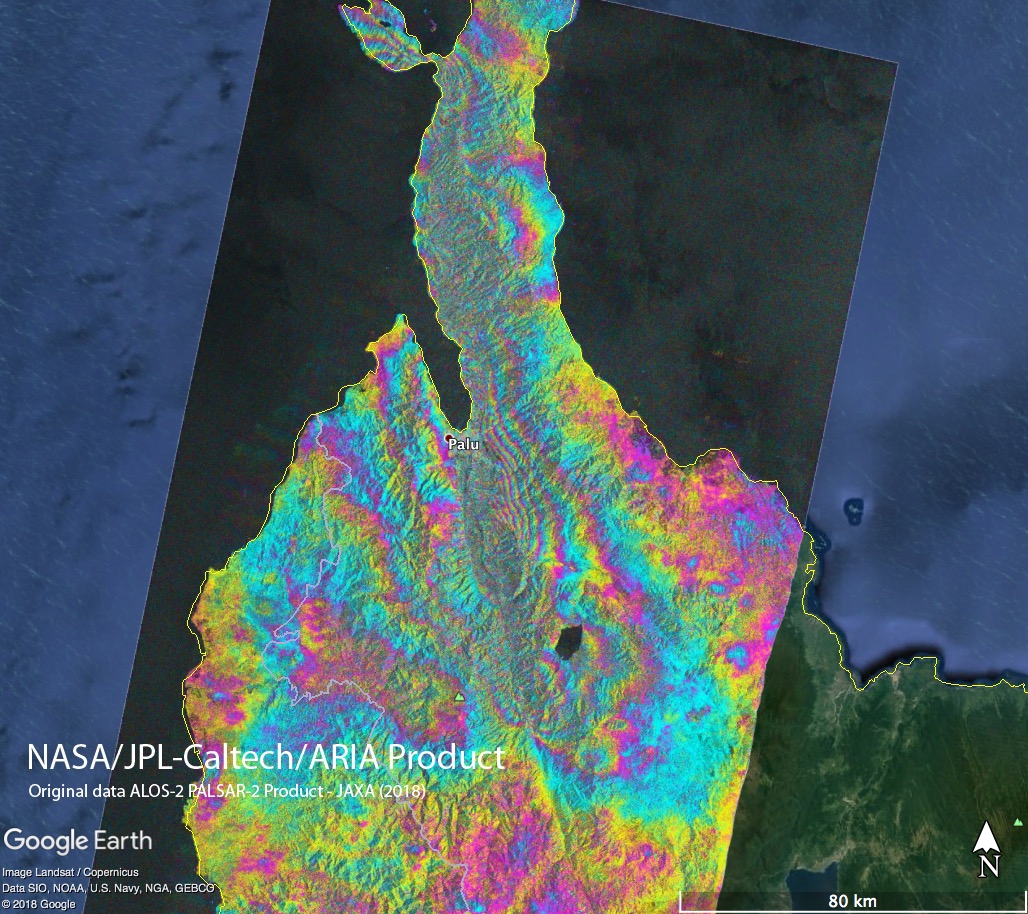
The map covers an area of 145 by 350 kilometers. Each pixel measures about 90 meters across. The colors on this map are portraying contours of the permanent ground deformation with a rainbow color scale. Areas with random speckle pattern changed too much during the earthquake to make a measurement, likely due to large fault slip, landslides, damage to buildings, or other processes. Each color contour is 12 cm (4.8 inches) of ground deformation in the direction from the ground to the radar satellite (up and east). This is called a wrapped interferogram.
The interferogram map was created by the NASA-JPL/Caltech ARIA team from the original ALOS-2 data. The original ALOS-2 PALSAR-2 data is copyright JAXA (2018) provided under JAXA ALOS RA6 PI project 3278. The algorithm development was carried out at JPL under a contract with NASA.
NASA/JPL-Caltech/JAXA
For more information about ARIA, visit: http://aria.jpl.nasa.gov