The Creek Fire in Sierra National Forest has become one of the largest fires in California history, and has destroyed 286,519 acres in Fresno and Madera Counties as of September 24 according to media reports. Researchers working with the NASA Earth Applied Sciences Disasters Program to study the air quality impacts of the fires used multiple Earth observing instruments to track the transport of smoke into the atmosphere from the Creek Fire. These observations show the smoke plume from these fires reaching all the way into the stratosphere – a relatively rare phenomena that was last seen in the devastating Australian fires in early 2020.
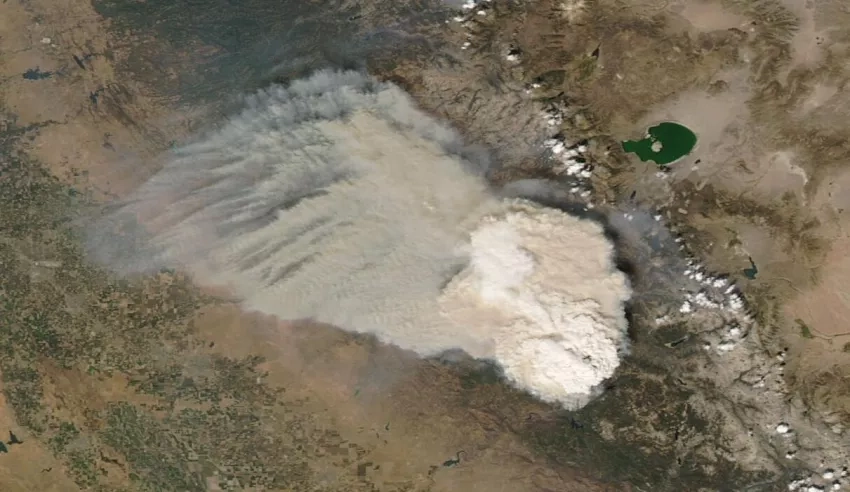
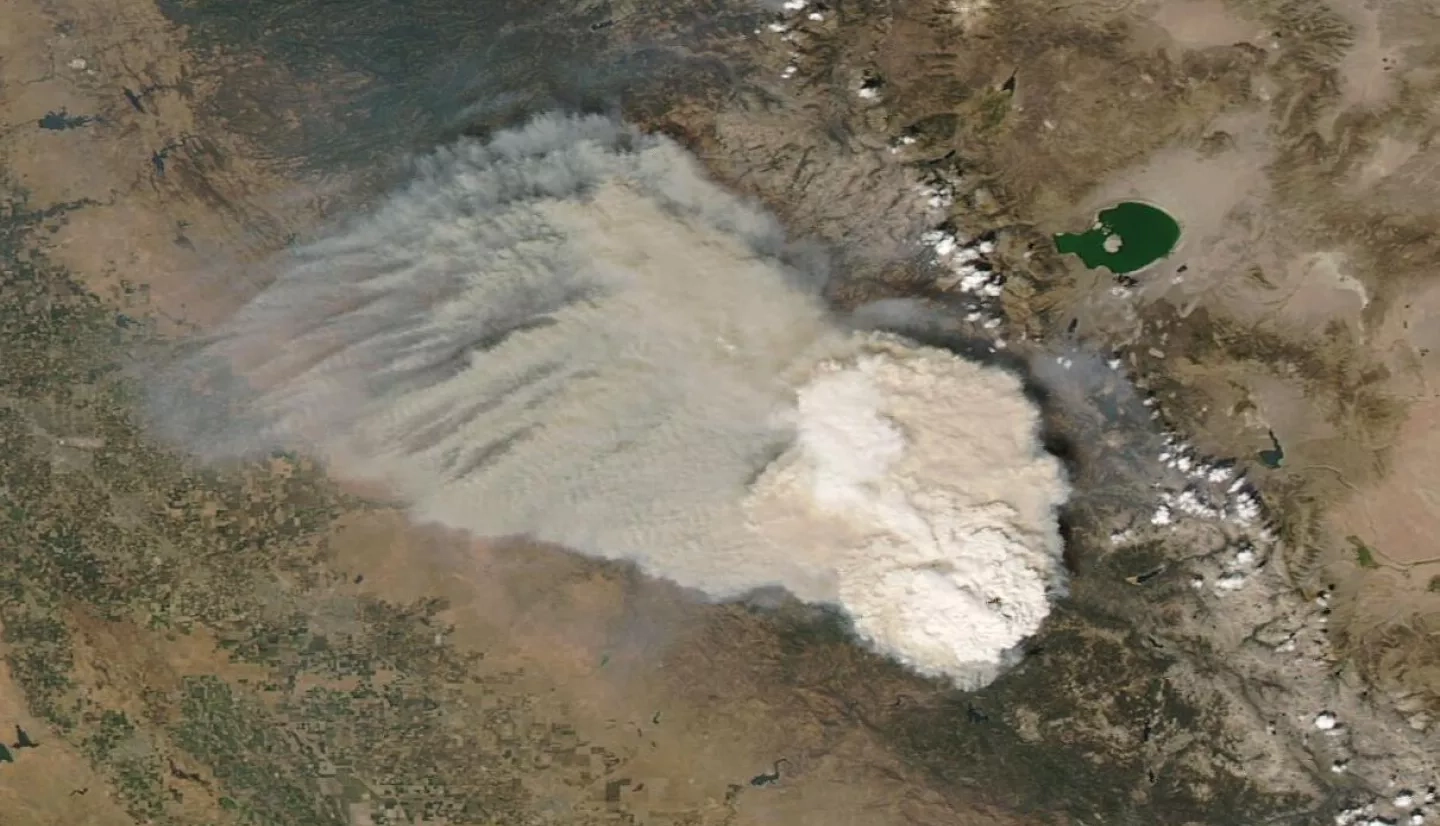
The Creek Fire started on September 4 around 6:21pm local time, while California was experiencing particularly hot and dry weather conditions. That weekend, California was in the midst of a historic heat wave, with temperatures in Los Angeles reaching nearly 121 degrees Fahrenheit - some of the highest temperatures ever recorded there. Extreme heat on the ground and mid-level atmospheric instability provided the conditions to create one of the largest pyrocumulonimbus clouds (fire-induced storm clouds, abbreviated as PyroCb) ever observed in the U.S.
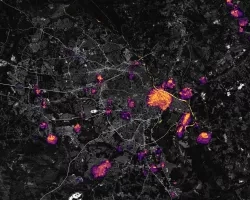
The explosion of atmospheric smoke, as shown in the above animation, was accompanied by an extremely rapid spread of fire on the ground. Hot spot anomalies detected by the NASA/NOAA Suomi-NPP satellites Visible Infrared Imaging Radiometer Suite (VIIRS) instrument expanded from about 20,000 acres to 90,000 acres within a day. PyroCb are known to produce high winds and lightning, which can trigger new fires miles away from the main fire, and rapidly increase the speed of the fires propagation.
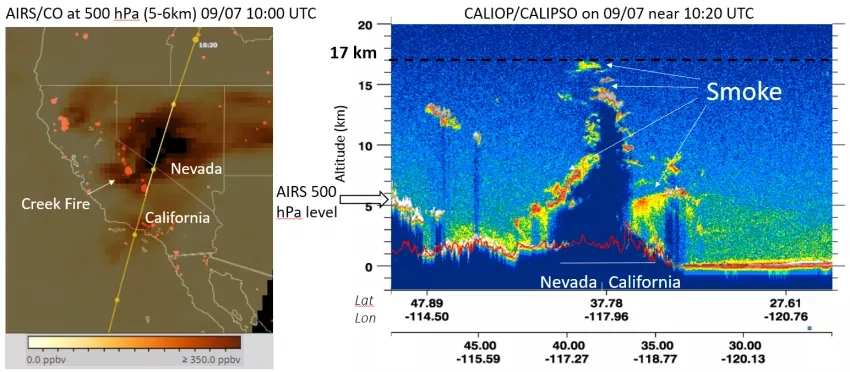
On September 7th two consecutive satellite observations from the A-train constellation observed high altitude smoke that was injected into the atmosphere by the Creek Fire PyroCb about 38 hours earlier. The Atmospheric Infrared Sounder (AIRS) on the Aqua satellite measured carbon monoxide emitted from the fire. 20 minutes later, the Cloud-Aerosol Lidar with Orthogonal Polarization (CALIOP) instrument on CALIPSO provided measurements of the vertical profile of smoke particles in the atmosphere, providing further insight into the phenomenon. As revealed by the paint brush-like detail of the CALIPSO lidar observations, the smoke plume reached as high as 17 km (~10.5 miles), touching the lower stratosphere. The boundary between the troposphere and stratosphere was at about 16 km that day, according to sounding balloon measurements taken in Las Vegas. The last time smoke from a fire reached this high into the stratosphere was in January 2020, when Australia was experiencing their own devastating fires.
Using CALIPSO observations of the smoke plume and initial fire conditions from the NOAA GOES-West satellite, researchers from NASA’s Langley Research Center (LaRC) modeled the trajectory of the smoke plume over the next 10 days, as shown in the above animation. Smoke layers are shown traveling at different speeds and directions as they are transported by atmospheric winds. In the mid-troposphere, between 6 km and 9 km, smoke is rapidly transported across North America and the North Atlantic Ocean, reaching Europe within 5 days. Smoke from the upper atmosphere, between 15 km and 16 km took two more days to arrive in Europe.
This simulation demonstrates the complexity of atmospheric transport of smoke, and the need for high-resolution observations combined with modeling to better understand the long-range dispersion of smoke into the atmosphere and its impact on air quality and atmospheric composition.
Coordinators and researchers from the NASA Earth Applied Sciences Disasters Program are hard at work developing maps, imagery and analysis such as these to aid local agencies and response teams in understanding the atmospheric impacts from the western U.S. fires. They are examining both air quality impacts on the ground and potential risks for aviation, such as reduced visibility for pilots and in-cabin air quality degradation. The program is working closely with other NASA teams such as the Health and Air Quality Applied Science program (HAQAST), and is aiding local stakeholders in developing air quality warnings, such as the Bay Area Air Quality Management District, the South Coast Air Quality Management District, and others. Learn more about these efforts.