UPDATE 9/5/19:
Hurricane Dorian continues to generate tremendous amounts of rainfall, and has left over three feet of rain in some areas of the Bahamas and is now lashing the Carolinas. NASA’s IMERG product provided a look at those rainfall totals.
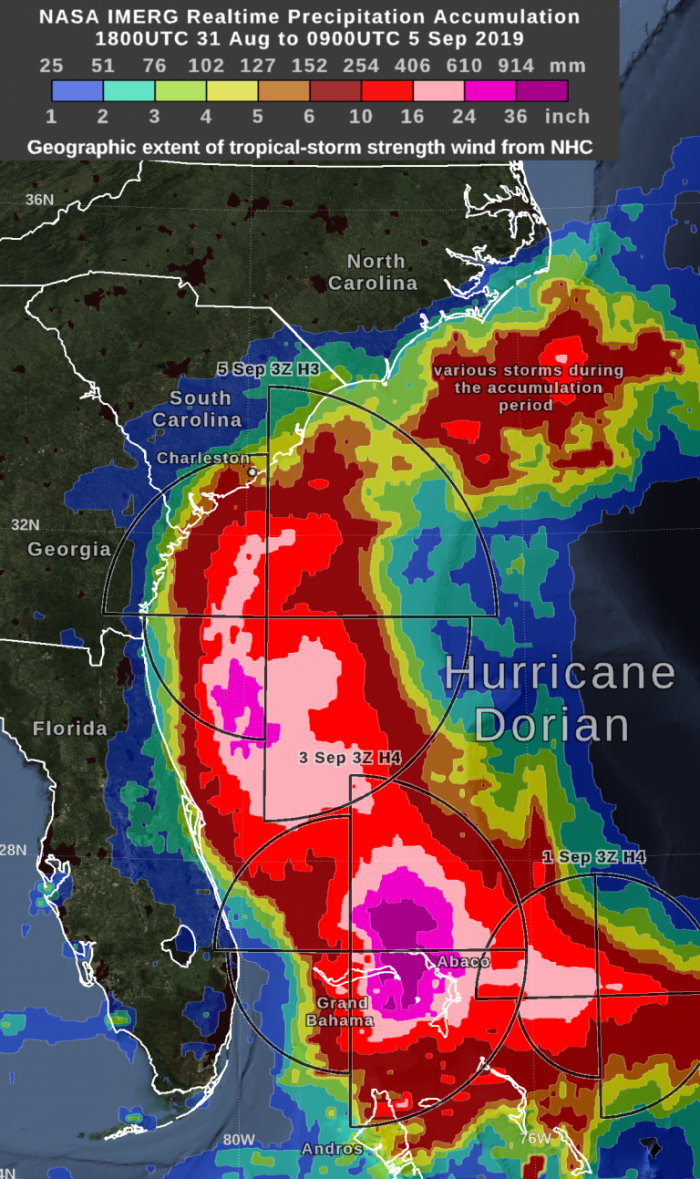
By September 5, Hurricane Dorian had dumped heavy rain on coastal South Carolina. An even greater accumulation of over 10 inches was occurring off shore along the path of Dorian’s inner core. In part because of Hurricane Dorian’s forward motion during the past two days, the recent rainfall totals have remained below the 36-inch accumulation observed when Dorian was stalled over the Bahamas. The graphic shows the distance that tropical-storm force (39 mph) winds extend from Hurricane Dorian’s low-pressure center as reported by the National Hurricane Center. The Saffir-Simpson intensity category is the number following the “H” in the label on the image.
By Thursday morning, September 5, Hurricane Dorian had dumped heavy rain on coastal South Carolina. An even greater accumulation of over 10 inches was occurring off shore along the path of Dorian’s inner core. In part because of Hurricane Dorian’s forward motion during the past two days, the recent rainfall totals have remained below the 36-inch accumulation observed when Dorian was stalled over the Bahamas.
NASA has the ability to estimate the rainfall rates occurring in a storm or how much rain has fallen. Rainfall imagery was generated using the Integrated Multi-satEllite Retrievals for GPM or IMERG product at NASA’s Goddard Space Flight Center in Greenbelt, Maryland. These near-realtime rain estimates come from the NASA IMERG algorithm, which combines observations from a fleet of satellites in the GPM or Global Precipitation Measurement mission constellation of satellites, and is calibrated with measurements from the GPM Core Observatory as well as rain gauge networks around the world. The measurements are done in near-real time, to provide global estimates of precipitation every 30 minutes.
The storm-total rainfall at a particular location varies with the forward speed of the hurricane, with the size of the hurricane’s wind field, and with how vigorous the updrafts are inside the hurricane.
UPDATE 9/3/19:
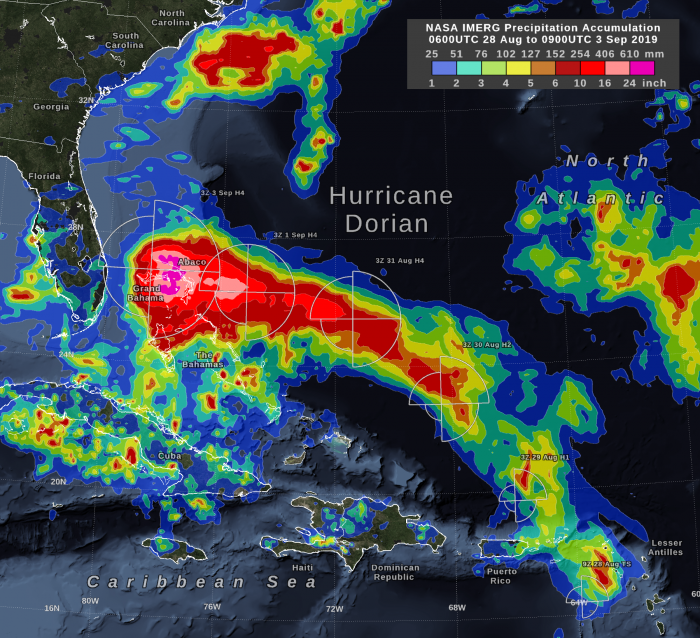
In the early hours of Tuesday, September 3, Hurricane Dorian had been stationary over the island of Grand Bahama for 18 hours, most of the time as a category 5 hurricane. Storm-total rain accumulation over parts of Grand Bahama and Abaco Islands have exceeded 24 inches according to NASA satellite-based estimates.
NASA’s IMERG storm-total rain accumulation over parts of Grand Bahama and Abaco islands have exceeded 24 inches according to NASA satellite-based estimates. The graphic also shows the distance that tropical-storm force (39 mph) winds extend from Hurricane Dorian’s low-pressure center, as reported by the National Hurricane Center. The symbols H and TS represent a hurricane of various Saffir-Simpson categories or a tropical storm, respectively.
Get more Hurricane Dorian news and updates at NASA's Hurricane Blog
UPDATE 8/30/19:
As Hurricane Dorian was upgraded to a Category 3 hurricane on the Saffir-Simpson Hurricane Wind Scale, NASA’s fleet of satellites were gathering data during the day to assist weather forecasters and scientists. At 2:00 pm EDT the National Hurricane Center (NHC) posted a supplemental advisory. NHC reports that “extremely dangerous Hurricane Dorian poses a significant threat to Florida and the northwestern Bahamas. The Hurricane Hunter plane finds Dorian is now a major hurricane.”
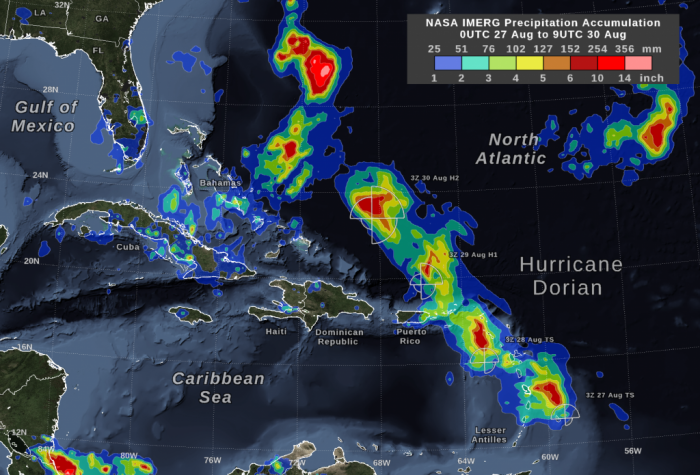
NASA’s Global Precipitation Measurement mission satellite uses its IMERG algorithm with data from a fleet of satellites to provide global estimates of the precipitation within the storm every 30 minutes. This map displays the estimated rainfall accumulation for the region from August 27th - August 30th, prior to Dorian becoming a Category 3 storm.
Get more Hurricane Dorian news and updates at NASA's Hurricane Blog
Image Credit: Owen Kelley (NASA GSFC)
Text Credit: Lynn Jenner (NASA GSFC)
UPDATE 8/29/19:
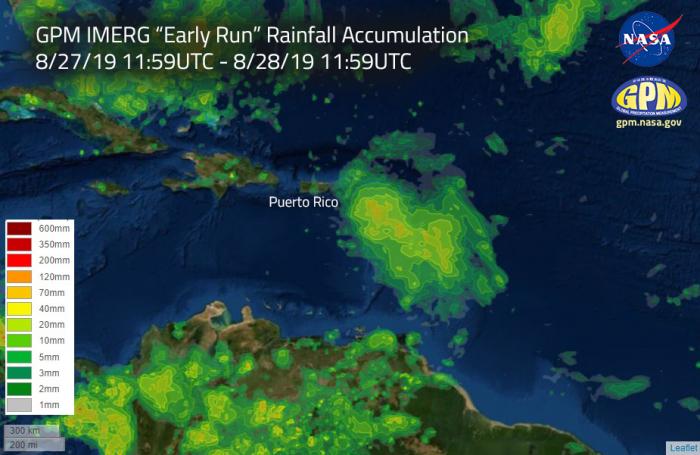
This image shows estimated rainfall accumulations for the region affected by Hurricane Dorian over a 24 hour period from August 27th - 28th. The imagery was generated using the Integrated Multi-satEllite Retrievals for GPM (IMERG) “early run” product. The data indicates that up to 120 mm (4.72 inches) of rainfall accumulated in certain regions during the 24 hour period.