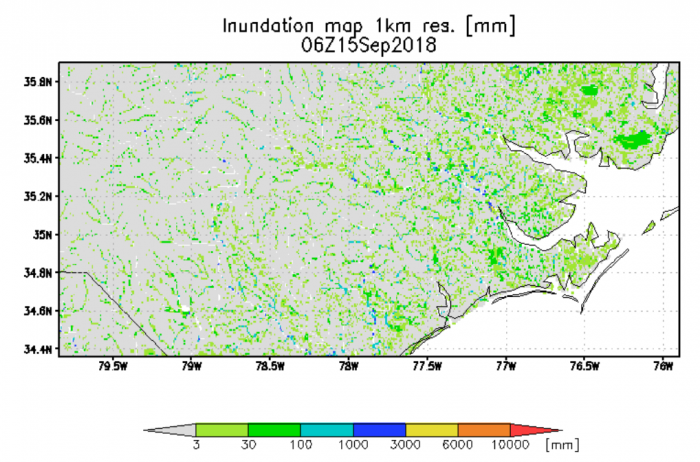
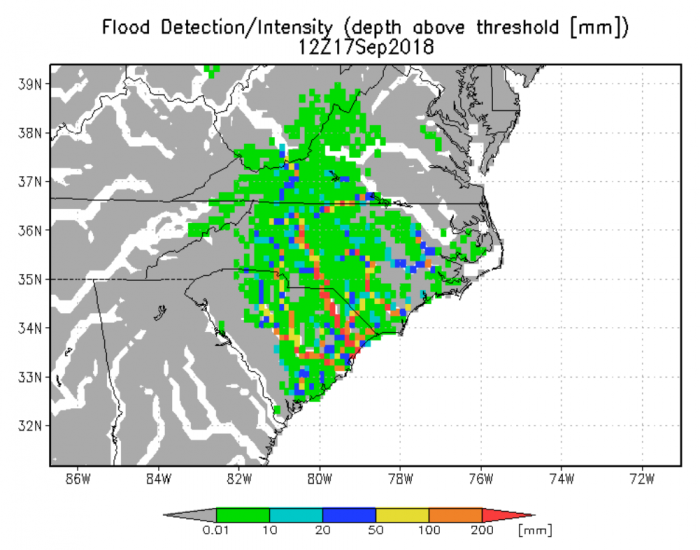
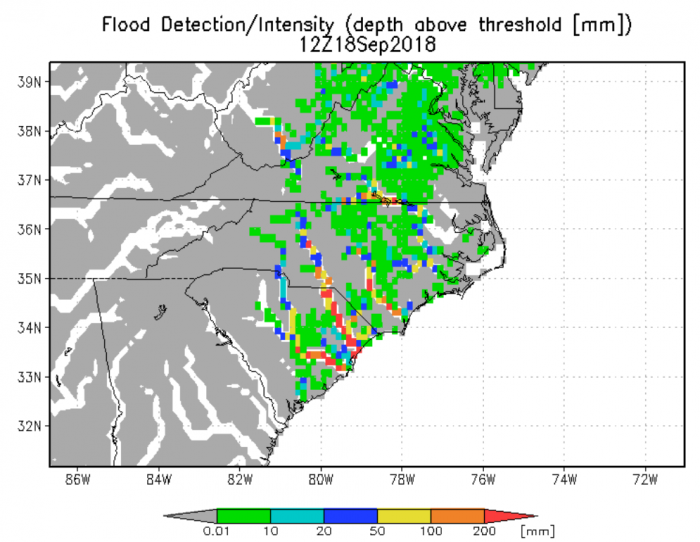
The GFMS is a NASA-funded experimental system using real-time TRMM Multi-satellite Precipitation Analysis (TMPA) and Global Precipitation Measurement (GPM) Integrated Multi-Satellite Retrievals for GPM (IMERG) precipitation information as input to a quasi-global (50°N - 50°S) hydrological runoff and routing model running on a 1/8th degree latitude/longitude grid. Flood detection/intensity estimates are based on 13 years of retrospective model runs with TMPA input, with flood thresholds derived for each grid location using surface water storage statistics (95th percentile plus parameters related to basin hydrologic characteristics). Streamflow,surface water storage,inundation variables are also calculated at 1km resolution.In addition, the latest maps of instantaneous precipitation and totals from the last day, three days and seven days are displayed.