UPDATE 9/18/18:
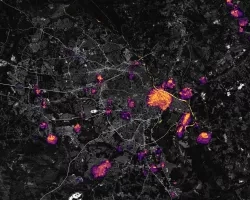
Soil moisture transformation from dry (brown/orange) to near saturation (purple/blue) over North Carolina associated with flooding rainfall from Hurricane #Florence (SPoRT-LIS product incorporating #MRMS precipitation). @NASA_LIS pic.twitter.com/SRgPnz5nL6
— NASA SPoRT (@NASA_SPoRT) September 18, 2018
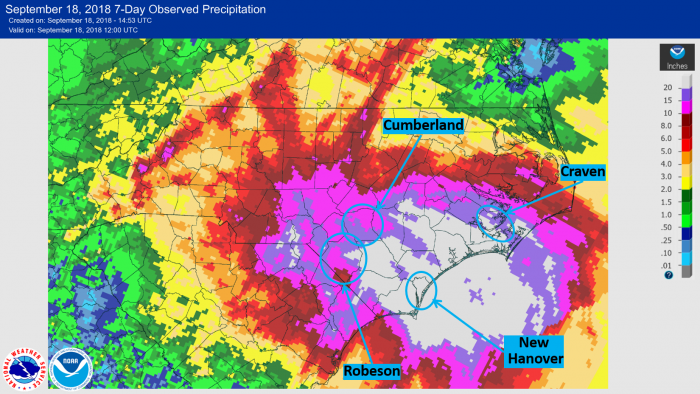
As anticipated, Hurricane Florence resulting in monumental rainfall totals, particularly across southern and eastern North Carolina. This past week’s rainfall totals are depicted in Figure 1, derived from the NOAA/National Weather Service Advanced Hydrologic Prediction Service (AHPS). Widespread totals exceeded 10” across most of southern/eastern North Carolina and far eastern South Carolina, with maximum rainfall of more than 20” along and within a few counties of the Atlantic Coast.
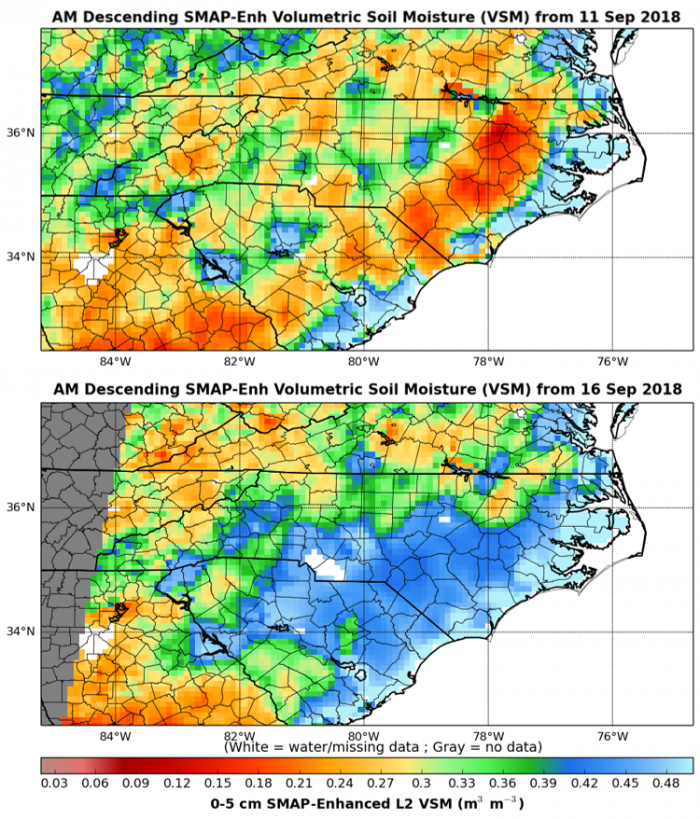
The extreme rainfall dramatically impacted the soil moisture, which underwent a substantial transformation from very dry to near-saturation across south-eastern North Carolina. Figure 2 shows soil moisture retrievals before and after Hurricane Florence from NASA’s Soil Moisture Active Passive (SMAP) mission, which estimates near-surface soil moisture (~top 5 cm) in near-real-time derived from passive microwave satellite observations.
Read more on "The Wide World of SPoRT" blog
UPDATE 9/14/18:
Soil Moisture Active Passive (SMAP) measures the amount of water in the top 5 cm (2 inches) of soil everywhere on Earth’s surface. SMAP is designed to measure soil moisture over a three-year period, every 2-3 days. This permits changes, around the world, to be observed over time scales ranging from major storms to repeated measurements of changes over the seasons and will also aid in the study of weather and climate.
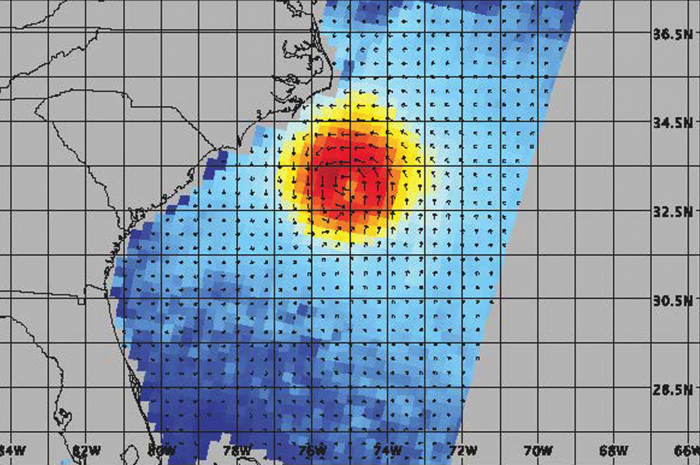
In this image we see weakening of the hurricane from the 12th to the 13th; however, the overall size and energy of the storm has increased. The brightness temperatures have been shown to yield unprecedented sensitivity to extreme wind speeds as compared to conventional Ku and C-band scatterometers.
SMAP is managed for NASA's Science Mission Directorate in Washington by NASA's Jet Propulsion Laboratory in Pasadena, California, with participation by NASA's Goddard Space Flight Center in Greenbelt, Maryland. JPL is responsible for project management, system engineering, instrument management, the radar instrument, mission operations and the ground data system. Goddard is responsible for the radiometer instrument. Both centers collaborate on the science data processing and delivery of science data products to the Alaska Satellite Facility and the National Snow and Ice Data Center for public distribution and archiving. JPL is managed for NASA by Caltech.
For more information about SMAP, visit http://smap.jpl.nasa.gov
UPDATE 9/12/18:
All eyes are on North and South Carolina as Major Hurricane Florence approaches the region over the next two days. One important component to the official forecast is for the storm to slow down as it approaches the coast, due to the collapse of major atmospheric steering currents. As a result, the NCEP Weather Prediction Center is predicting extreme rainfall amounts, especially for southeastern coastal North Carolina where 15-20”+ of rainfall is anticipated over the next 7 days (Fig. 1).
An examination of the antecedent soil moisture is helpful to qualitatively assess the ability of the ground to absorb some of the moisture from the incoming rainfall. Figure 2 shows a collage of shallow to deep soil moisture percentiles from 12 September within the four layers of the Noah land surface model, as being run in real time within NASA SPoRT’s configuration of the Land Information System (i.e., “SPoRT-LIS”). The percentiles are derived from a 1981-2013 database of SPoRT-LIS daily soil moisture values in order to compare the present-day soil moisture to historical values on any given day of the year. In Fig. 2, we see that recent soil moisture values are historically quite dry over central/northern South Carolina and into far southern North Carolina, with values under the 10th percentile (and even 2nd percentile, yellow/red shades) in some areas. Meanwhile, as one traverses inland and northward, the soils steadily moisten to anomalously wet conditions (green/blue shades), especially over interior North/South Carolina to the Appalachian Mountains.