Hurricane Matthew has come and gone, but flooding associated with the storm’s torrential rains persists in the southeastern United States. Flooding in North Carolina, for example, is the worst to hit the state since Hurricane Floyd in 1999, according to news reports.
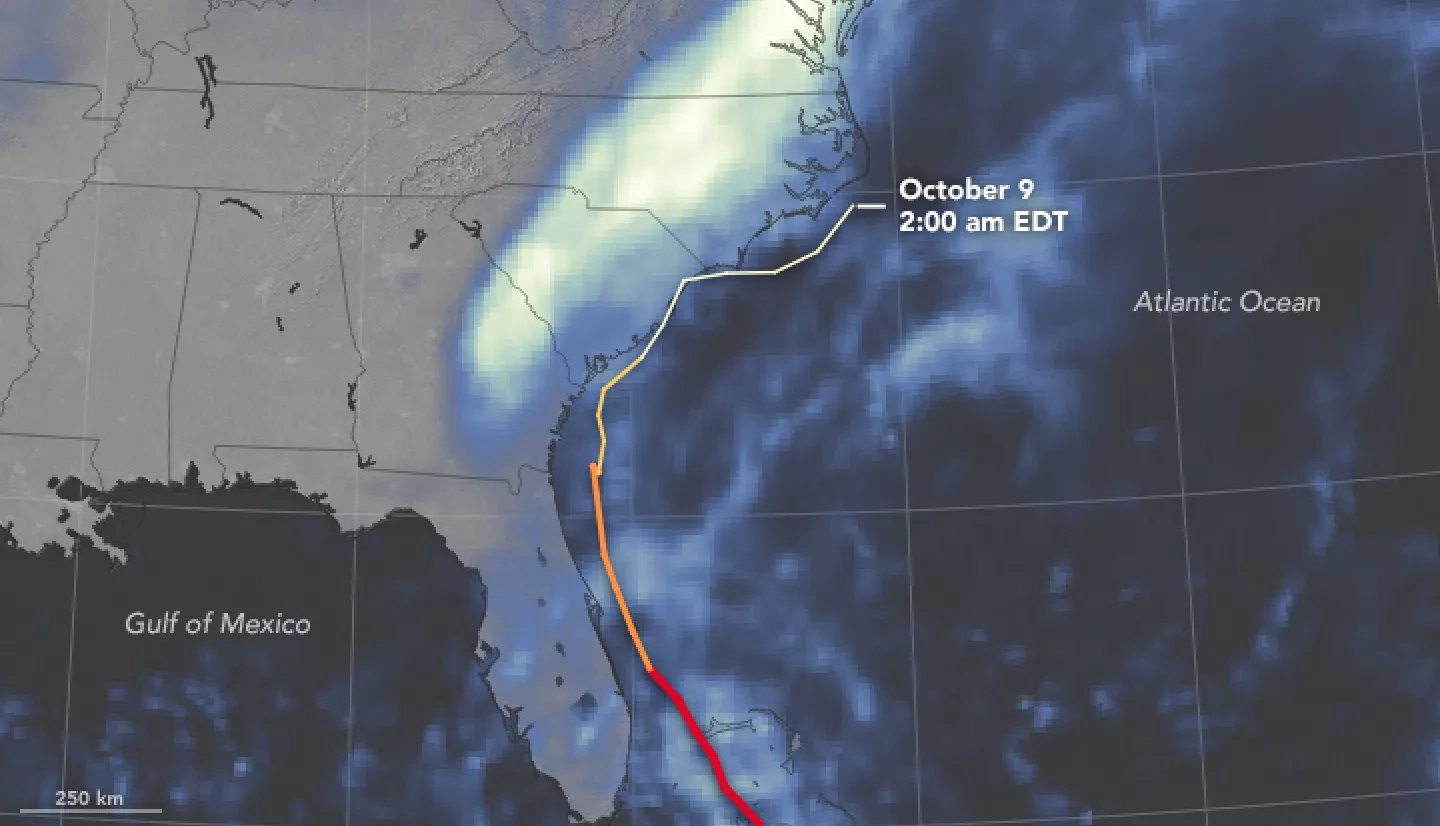
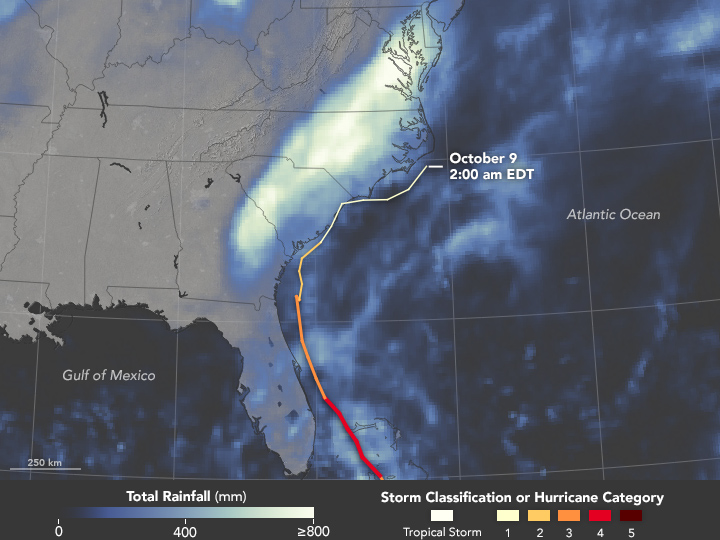
Matthew began dropping large amounts of rain while offshore of South America. As the category 4 storm curved northward, intense rainfall continued on a track between Haiti and Cuba. By October 8, 2016, when Matthew made landfall northeast of Charleston, South Carolina, it had weakened to a category 1 storm. Its center stayed mostly offshore as it tracked northward. Still, storm surge and torrential rains caused damage from Florida to southeast Virginia.
This map depicts satellite-based measurements of rainfall that fell on the southeastern United States from September 28 to October 10, 2016, as compiled by NASA. These rainfall totals are regional, remotely-sensed estimates, and local amounts can be significantly higher when measured from the ground.
Rainfall data come from the Integrated Multi-Satellite Retrievals for GPM (IMERG), a product of the Global Precipitation Measurement mission. IMERG pulls together precipitation estimates from passive microwave and infrared sensors on several satellites, as well as monthly surface precipitation gauge data, to provide precipitation estimates between 60 degrees North and South latitude. The GPM satellite is the core of a rainfall observatory that includes measurements from NASA, the Japan Aerospace Exploration Agency, and five other national and international partners.
References
- National Hurricane Center (2016, October 9) Hurricane MATTHEW Advisory Archive. Accessed October 11, 2016.
- Weather Underground (2016, October 11) Hurricane Matthew Floodwaters Slowly Recede; Hurricane Watch for Nicole in Bermuda. Accessed October 11, 2016.
NASA Earth Observatory map by Jesse Allen, using IMERG data provided courtesy of the Global Precipitation Mission (GPM) Science Team’s Precipitation Processing System (PPS). Caption by Kathryn Hansen.