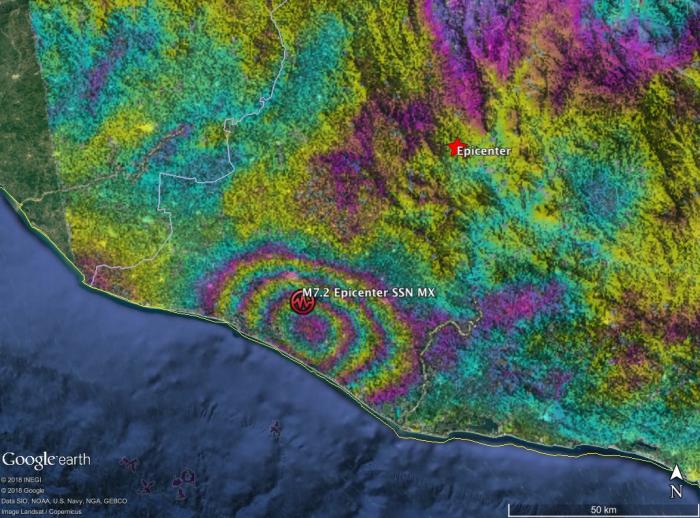
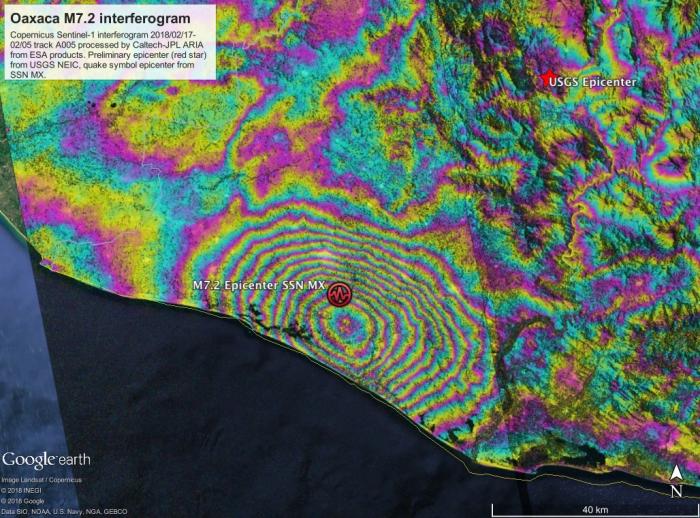
Interferogram from modified Copernicus Sentinel-1 SAR data acquired 2018/02/17 and 02/05 shows earthquake fault slip on subduction megathrust beneath coast caused up to 40 cm of uplift of the ground surface. Interferometric SAR (InSAR) analysis was automatically performed by Caltech-JPL ARIA data system. Main image shows motion towards satellite (up and west) in radar line-of-sight direction. Additional images show motion contoured with 9 cm (image 2) and 2.8 cm (image 3) color contours, also known as fringes, displayed in Google Earth. Symbols show preliminary USGS and Mexican seismic network (SSN) estimated locations of earthquake epicenter.
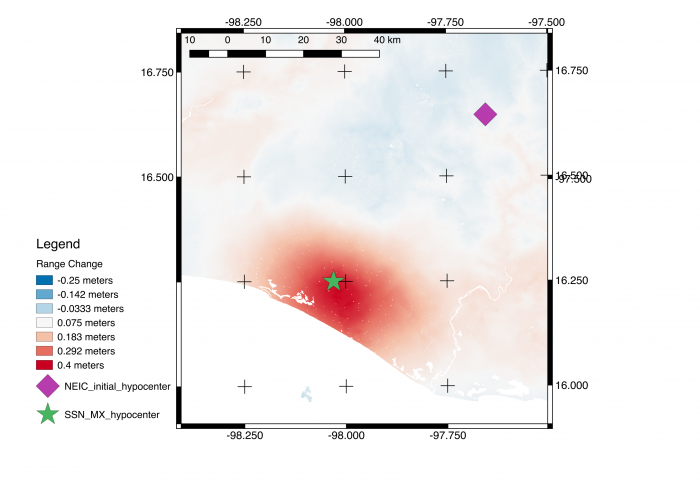
The interferogram shows that the location of the earthquake was close to the coast, far from the initial USGS epicenter location. This information was used to revise the USGS fault model, ShakeMap, and PAGER damage estimate.