When disasters occur, civil protection agencies and organizations need data, such as remote sensing data from NASA’s many satellites, to inform their decisions. Earth data relevant to disasters is quickly becoming more plentiful, but this abundance is only one side of the story. End-users around the world may find abundant data but discover that data is not in an immediately useful format. Often, the available data is geared towards scientists and other researchers in specific fields. The complexity of the data means additional, time-consuming work to process and analyze the information often has to happen before emergency managers can make effective use of it.
User-friendly interfaces accompanying such datasets can provide emergency managers with valuable and timely input to inform better decisions regarding disaster mitigation, preparation and response. That’s why NASA’s Earth Applied Science Disasters Program is increasing accessibility through innovative tools that make important data user-friendly for a diverse range of civil protection agencies and organizations. In that effort, the program’s Geographic Information Systems (GIS) team has developed – and continually improves upon – a Disasters Mapping Portal (https://maps.disasters.nasa.gov).
Disaster management professionals around the globe use the Mapping Portal to access scientific data and produce highly relevant and informative maps. Recently, the Disasters Program’s GIS Team enhanced the portal by integrating data from NASA’s Soil Moisture Active Passive (SMAP) satellite into it. Because of this, end-users worldwide now have convenient access to timely acquisition of soil moisture data. That data is especially useful when it comes to floods and fires. Decision-makers can use that enhanced information to identify dry areas in a region experiencing fires and determine where the fires are likely to travel. Soil moisture data can help analysts predict which local regions in the path of an impending hurricane may experience flooding. This upgraded capability provides decision-makers with practical information to help them better prepare for disasters and natural hazards.
Not only does the data offer a predictive value, it also allows for the incorporation of other datasets by end-users into their maps, adding a customizable element to the tool. Emergency managers can develop a more accurate, customizable and near-real time situational awareness with the aid of the Mapping Portal and newly integrated SMAP data. For instance, an emergency manager preparing for a hurricane could use the SMAP data to pinpoint where flooding is most likely to occur while also adding in census data to display local concentrations of elderly citizens. This combined information allows emergency managers in such a situation to estimate where evacuation may require more time and effort.
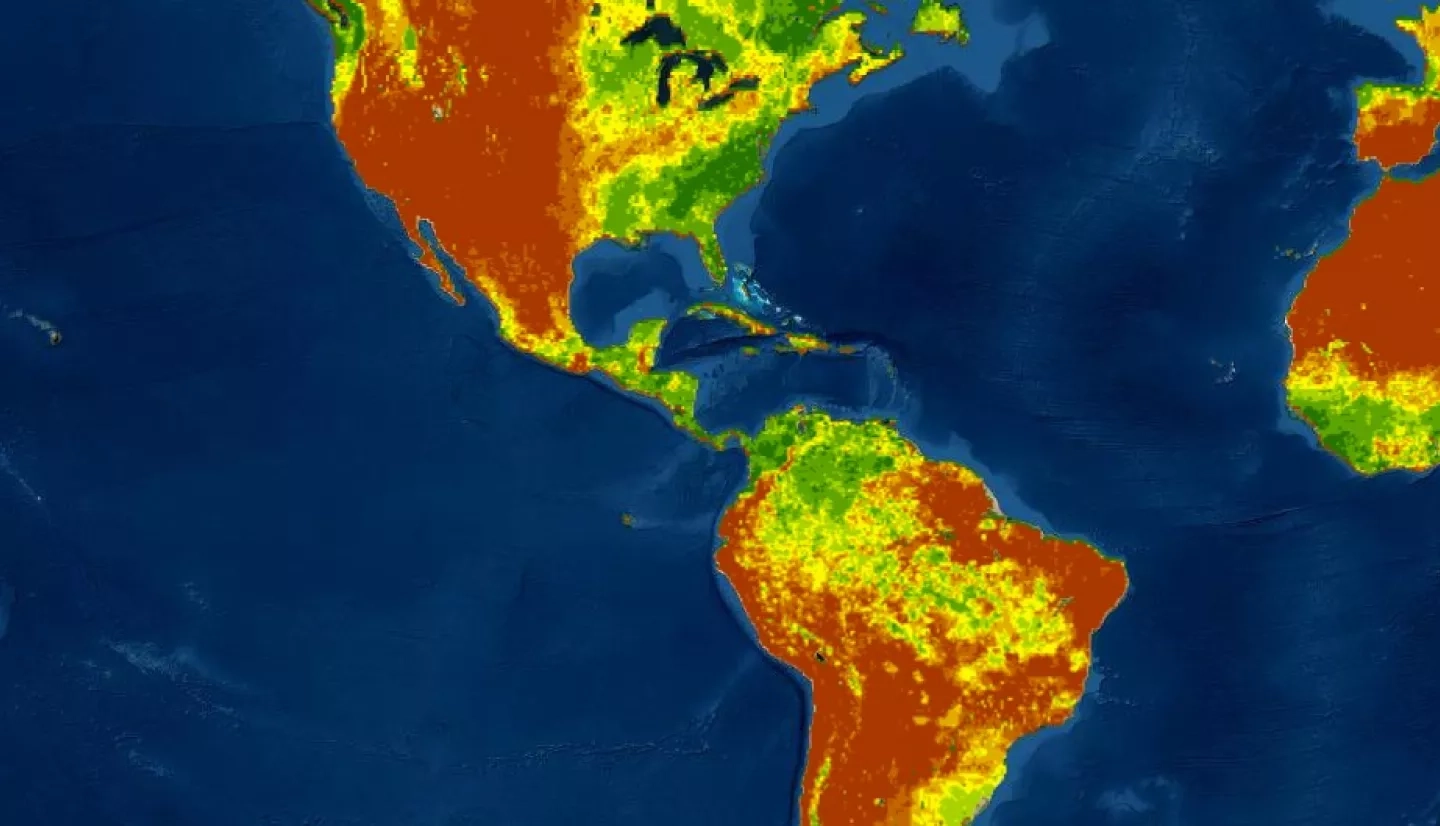
Using ArcGIS as the “backbone” of the Mapping Portal, the program’s GIS team developed a script that converts the valuable soil-moisture data into a GIS-friendly format embraced by organizations worldwide. This new format means end-users can now view one information-rich and easy-to-analyze map of a region rather than numerous separate and highly technical pieces that could only be pieced together by experts familiar with the field. Through this newly integrated system, the team offers two different SMAP-based products. The first product displays a general surface soil moisture map that allows users to see areas of wet versus dry conditions. The second offers practical context to situations by displaying anomalies in soil moisture. It shows areas that are abnormally wetter or drier than average for a given time of year, compared to typical conditions. White areas convey locations where conditions meet the expected norms, while a color scale allows users to identify abnormally dry or wet regions.
This influential data is now accessible in a user-friendly, easily sharable environment. The scripts that the Disasters Program’s GIS team developed to incorporate this data removes the need for any additional processing by emergency managers. The Disasters Mapping Portal allows them to capture only the relevant, near real-time data they need and maintain focus on their critical jobs during a disaster or in preparation for one. The Disasters Mapping Portal is a remarkably powerful tool. Incorporating the Soil Moisture Active Passive (SMAP) satellite data into the portal strengthens the portal further. This new feature provides insights for users that will lead to improved emergency preparedness and response worldwide.
Credits:
Story by Carmen Atkins