To map the spatial extent of the Montecito mudflows that occurred on 9th January 2018, east of Santa Barbara we used optical images acquired by Planet Labs’ dove satellite constellation (Planet Team, 2018). We used a total of eight images, three from before (December 28, 29, 30) and five after (January 10, 11, 12, 13, 18) the mudflow event. To quantify changes between the 3.7 m resolution images we differenced the mean of the visible bands (455-515 nm, 500-590 nm, 590-670 nm) and near-infrared bands (NIR, 780-860 nm) for all image pairs using QGIS and MATLAB. We then stacked the visible and NIR results to suppress random changes between images. Areas of debris flow in the visible differencing result appear as bright, positive regions due to changes from vegetation to mud and soil, also capturing smaller debris flows upstream in the drainage basins. The NIR result better resolves the spatial extent of the toes of the debris flows towards the coast (darker areas), likely due to damage and loss of vegetation.
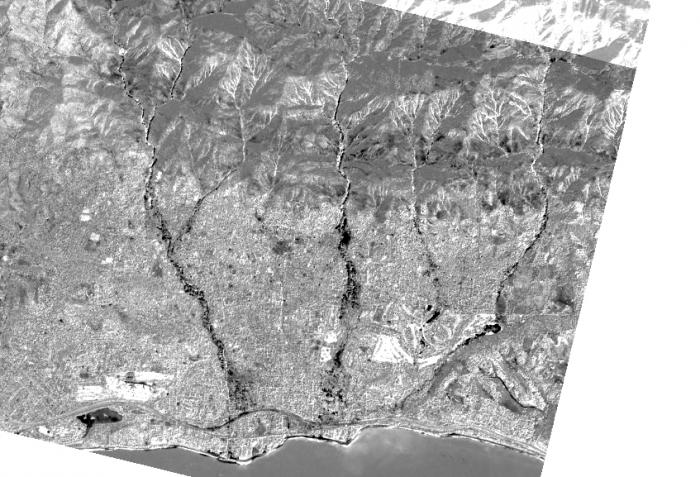
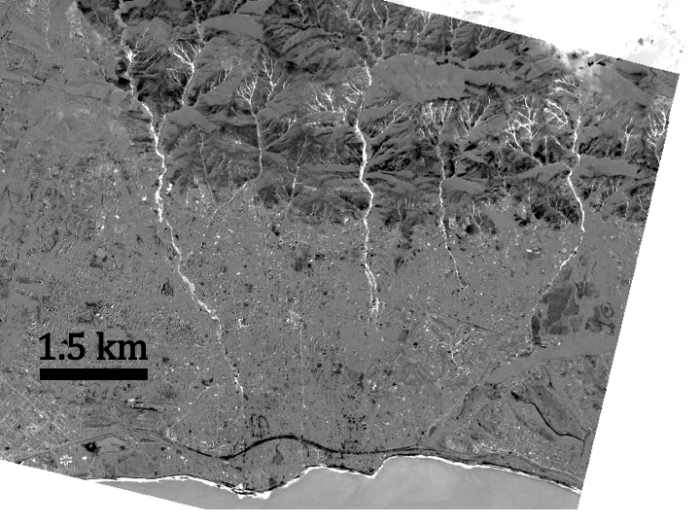
The first image is the geotiff of the stacked NIR band and the second image is an image of the visible band. Both images are in UTM Zone 11 N co-ordinate system, WGS-84 datum.