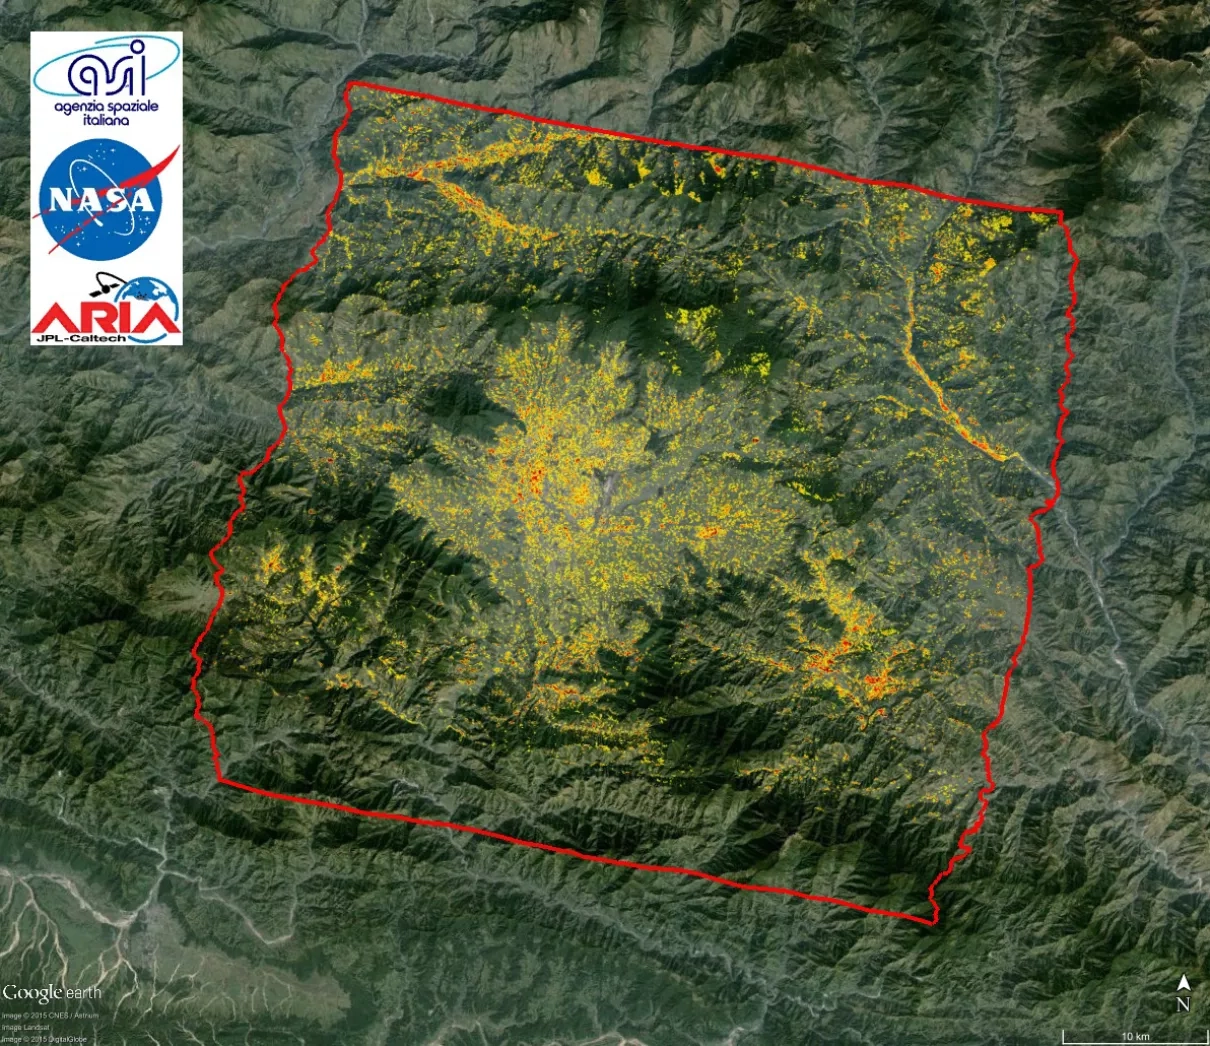
The Observatory also accepts GIS flood inundation limits from other sources and incorporates this information with permission of the authors. The date of last update is shown on each map. A large scale Geotif version is also available.
Color coding for previous flooding: 2015, 2014, 2013, 2012, 2011, 2010, 2009, 2008, 2007, 2006, 2005, 2004, 2003, 2002, 2001, 2000, pre-2000. The Shuttle Water Boundary Data (SWBD, February, 2002) are at 90 m spatial resolution and provide a useful reference water between latitudes 60 degrees south and 56 degrees north. Where used, it is the uppermost map layer (this color). Otherwise, the map layers are arranged sequentially by year, with oldest at bottom.
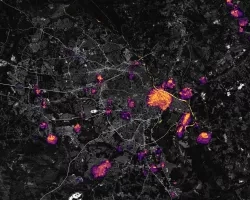
Red is current surface water (flooding) where it is extending beyond the SWBD information. Twice-daily imaging (Terra-MODIS and Aqua-MODIS, at 250 m spatial resolution) of surface water is accumulated over 14 days to remove nearly all cloud obscuration. The map date refers to a two week period ending on that date. Floods in mountainous regions are exceptionally hazardous, but they are difficult remote sensing targets and not always observable. Additionally, cloud cover or other constraints sometimes restrict the ability to capture peak inundation everywhere. The displays do not illustrate all areas of possible current flooding.
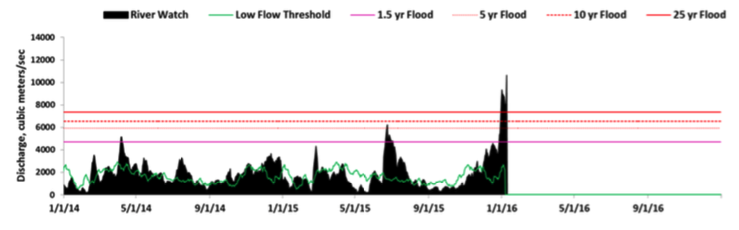
River Watch Measurements
At selected locations, a time series of satellite microwave-based daily river discharge measurements are available from the Flood Observatory. See River Watch Global Display for more information. A sample from Site 501 in this map sheet is shown below. In the online version of this map sheet, the river reaches monitored by each site are clickable and provide data access. White triangles: ice covered. Yellow dots: low flow (<5th percentile mean daily runoff for this date, 1998-2012); Blue dots: normal flow; Purple dots: moderate flooding (>1.5 yr recurrence); Red dots, major flooding (> 5 yr recurrence).