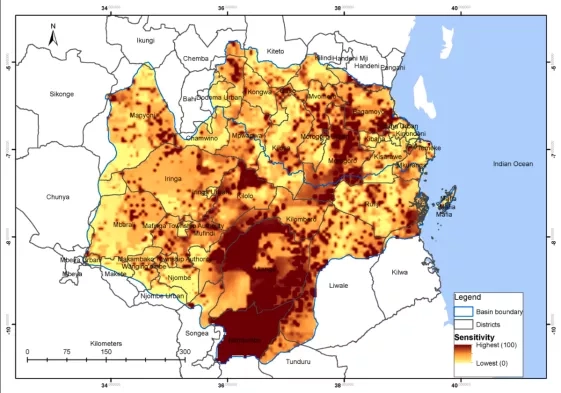
When Denis Macharia and his colleagues were mapping how likely Tanzanian communities are to experience water shortages, they had a lot of data to look through. In addition to monitoring climate data and water levels, they also needed to understand the human elements, like population and urban centers. Many population data sets focus on broad spatial regions, making it hard for researchers to pinpoint specific communities. Macharia’s team also needed insight into how many households were subject to socioeconomic risk factors, like health risks or a low standard of living.
Macharia is the weather and climate lead for SERVIR, a joint program between NASA and the United States Agency for International Development (USAID), in Eastern and Southern Africa. He knew where to look to get the data they needed: the Socioeconomic Data and Applications Center (SEDAC). Hosted by the Center for International Earth Science Information Network at Columbia University, it’s one of NASA’s many data archives in the U.S., called distributed active archive centers (DAACs). Each DAAC stores a different kind of data, from ocean biology to land processes — and SEDAC focuses on data that show the connection between humans and their environments.
Maintained by NASA’s Earth Observing System Data and Information System, SEDAC integrates socioeconomic and Earth science data to provide a human-centered perspective on topics like air quality, food insecurity, and deforestation. It serves as an archive for interdisciplinary data sets that combine remote sensing with socioeconomic data sets to show how humans interact with and impact the environment.
Presenting data like this illustrates a community’s susceptibility and vulnerability to disasters and climate impacts. Susceptibility measures the likelihood that an event could occur, while vulnerability measures how many people will be impacted, and how strongly.
Using SEDAC data, Macharia visualized which communities were most at risk from climate change through vulnerability maps. Organizations in Tanzania used those maps to make informed decisions on land use plans, distribution of aid, and more. Decision makers even used the maps as one of their criteria for choosing the locations for 50 water projects, which will provide clean water for 520,000 people.
SEDAC has helped countless other projects include the human element of an issue, too. Within the Capacity Building program area, its DEVELOP program has used SEDAC data sets for population count and density in projects like the Southern Bhutan Ecological Forecasting and the Talamanca-Osa Ecological Forecasting II projects. Capacity's Applied Remote Sensing Training (ARSET) program has also introduced its participants to SEDAC data in trainings like the Earth Observation for Disaster Risk Assessment & Resilience training.

“SEDAC allows users not familiar with more complicated remote sensing data to see ways the remote sensing data is useful to them,” explained Nancy Searby, the program manager for Capacity Building and program scientist for SEDAC. “It also allows Earth scientists to look at their science question in combination with the contribution of and impact to people. By combining spatial and socioeconomic data, we can empower decision makers to make informed choices on how and where to address climate change and human equity.”
How Scientists Use SEDAC
When used with other environmental science data, scientists can use SEDAC’s socioeconomic datasets to get a complete picture of all the ways humans impact — and are impacted by — environmental factors, like climate change or natural disasters. For example, scientists and researchers like Macharia can use satellite data to identify where drought is occurring and where underground aquifers exist, but they also need data on the impacts of drought on agriculture and population. By combining these different data sets, they can analyze which aquifers may be most accessible for use or at highest risk of depletion. SEDAC provides a two-way street for environmental science datasets and human-centered data, making it easier for scientists to combine these perspectives in their work and create policy-relevant information.
SEDAC offers guides and trainings to help users access the data. SEDAC also offers several tools that help users parse the data in different ways. If you want to compare spatial population data sets from different sources, for example, the POPGRID Viewer tool is a great resource. This tool and others housed on SEDAC’s website help scientists of all disciplines accomplish their goals and conduct meaningful research.
How SEDAC Listens to Scientists
With so many data sets that could be included, NASA and SEDAC need to listen to users to decide what data is most appropriate and useful. That’s where the SEDAC User Working Group comes in. The User Working Group, which is composed of 19 members from academia, the private sector, and government organizations, represents the user community in the development of SEDAC products and services. The group meets regularly to suggest new data products and services, review data sets prior to distribution, and provide strategic input to SEDAC’s objectives and approaches. SEDAC recently announced a new Chair on March 15, 2022: William Easterling III, who serves as a Professor of Geography and Earth System Science at the Pennsylvania State University and formerly served as Assistant Director of the National Science Foundation Geosciences Directorate. The User Working Group also recently welcomed six new members who represent social scientists, policy makers, and the general public.
“SEDAC strives to be the place where there’s consistent information about population, human-built infrastructure, human vulnerability and human-environment interactions that could be combined easily with other NASA satellite data” said Searby. “Accomplishing this goal,” continued Searby, “would enable more people to use the data. It would also help scientists better understand the influence of people on the environment — and the environment on people.”
---
Want to learn more about how to use socioeconomic data in your research? Check out the helpful guides on how to use SEDAC’s tools and maps at the SEDAC website.
---