As fires continue to rage in California and across the western U.S., NASA’s Earth Applied Sciences Disasters Program is aiding local agencies by using satellite and airborne instruments to help track the burned areas and map damage to infrastructure and the environment.
The Bobcat Fire in Southern California started September 6th, and as of September 21st has burned over 100,000 acres according to media reports, making it one of the largest fires in Los Angeles County’s history. Using satellite data collected before and during the fires, the Advanced Rapid Imaging and Analysis (ARIA) team at NASA's Jet Propulsion Laboratory (JPL) and California Institute of Technology (Caltech) in Pasadena, California, created several Damage Proxy Maps (DPM’s) of the Bobcat fire showing regions likely burned or damaged.
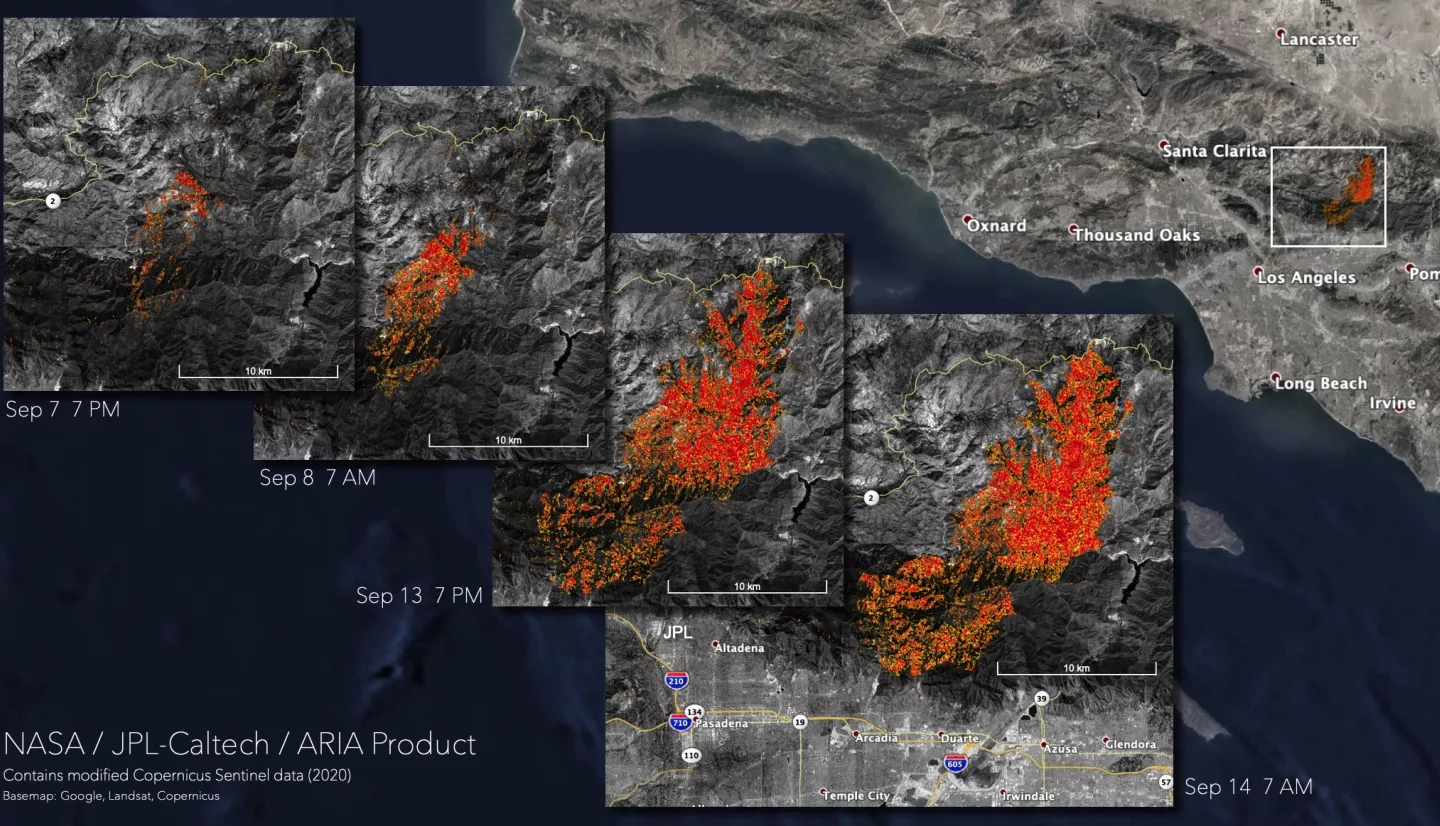
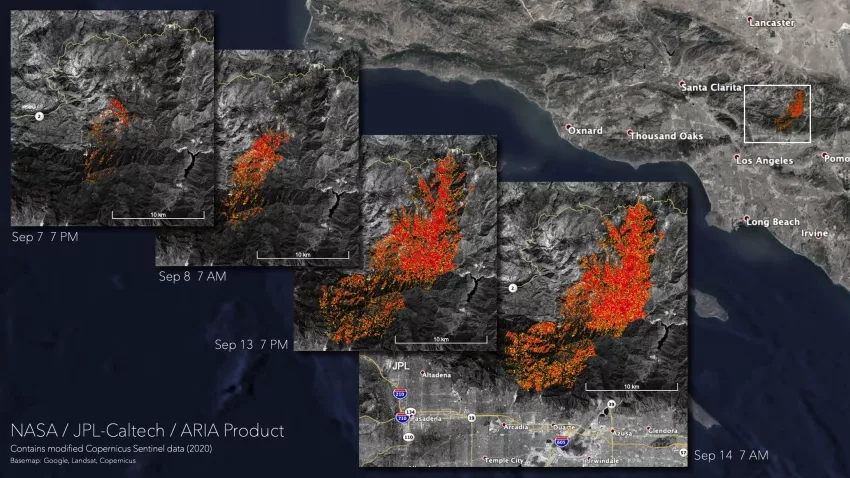
The image above shows regions in the Angeles National Forest that were likely damaged by the fires on September 7th, 8th, 13th, and 14th, with yellow indicating moderate damage and red indicating more severe damage. Using these maps you can see the progression and spread of the fire over the course of the week, and the proximity to local roads and infrastructure. The maps were provided to the California Department of Forestry and Fire Protection (CAL FIRE) and the Federal Emergency Management Agency (FEMA) as part of NASA's efforts supporting risk management for the western U.S. fires, and have been made available in Geographic Information Systems (GIS) format on the NASA Disasters Mapping Portal.
The map was created by comparing synthetic aperture radar (SAR) data collected by Copernicus Sentinel-1 satellites, operated by European Space Agency (ESA), before (September 1 and 2, 2020) and during the fire (September 7th 7pm, September 8th 7am, September 13th 7pm, and September 14th 7am local time). The maps cover an area of 25 miles x 17 miles (40 km x 28 km), indicated by the white polygon. Each pixel of damage detection measures about 33 yards x 33 yards (30 m x 30 m). Preliminary validation was done by comparing to independent observations by NASA’s VIIRS and MODIS sensors available at the Fire Information for Resource Management System (FIRMS) and fire perimeter information available at the National Interagency Fire Center (NIFC).
Coordinators and researchers from the NASA Earth Applied Sciences Disasters Program are hard at work developing maps, imagery and analysis such as these to aid local agencies and response teams in understanding the impacts from the western U.S. fires and the potential risks to people, infrastructure, and the environment. The Program is working closely with stakeholders from the California State Guard, the Federal Emergency Management Agency (FEMA), and many others. Learn more about these efforts.