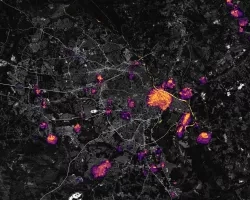
NASA data shows that in many parts of the state the soil is already saturated with moisture - a condition that could lead to increased flooding as Hurricane Dorian heads for a potential landfall in central Florida.
Analyzing soil moisture conditions in advance of an approaching weather system helps researchers and disasters response agencies anticipate the impact of heavy rainfall and identify regions which are more likely to experience runoff and flooding. Using a land surface modeling system which incorporates near real-time satellite observations, NASA developed soil moisture maps for the region.
This interactive slider allows comparison in SPoRT-LIS soil moisture between the near-surface layer on the left (0 – 10cm) and the deeper layer on the right (0 – 2m) on Sunday, August 25, 2019. Relative soil moisture is reflected by the colors shown, ranging from gray (0%) to red (100%). 0% represents the wilting point of soil moisture, which means that vegetation can no longer extract water from the ground. 100% indicates complete saturation, which means that the soil can no longer hold any more water. Click the layers icon in the upper right corner to view the full colorbar and legend.
The Short-term Prediction Research and Transition Center (SPoRT) at NASA’s Marshall Space Flight Center manages a real-time instance of the NASA Land Information System (LIS) at around 3-km resolution over the Continental U.S. This “SPoRT-LIS” product incorporates near real-time satellite data from the joint NASA/NOAA Suomi National Polar-orbiting Partnership (Suomi NPP) satellite to generate daily modeled estimates of soil moisture in a 2 meter deep column. The near-surface (0 - 10 cm) layer responds quickly to recent heavy rainfall, with near-saturated conditions promoting infiltration into deeper soil layers, as well as increasing the potential for runoff and flooding if deeper layers are already very moist and rainfall rates are sufficiently high. Meanwhile the total-column layer (0 – 2 m) represents longer-term soil water storage via infiltration from the upper layers, representing saturation over a period typically spanning months to years. The data integrated into the SPORT-LIS model includes Suomi-NPP green vegetation fraction, radar/gauge-derived precipitation estimates, and atmospheric analysis fields. These data are processed along with static soil and land-use classifications to generate the final modeled soil moisture map.


