Researchers from NASA’s Goddard Space Flight Center used data from the NASA Soil Moisture Active Passive (SMAP) satellite to track the correlation between soil moisture conditions and wildfire susceptibility in the 2020 California wildfire season.
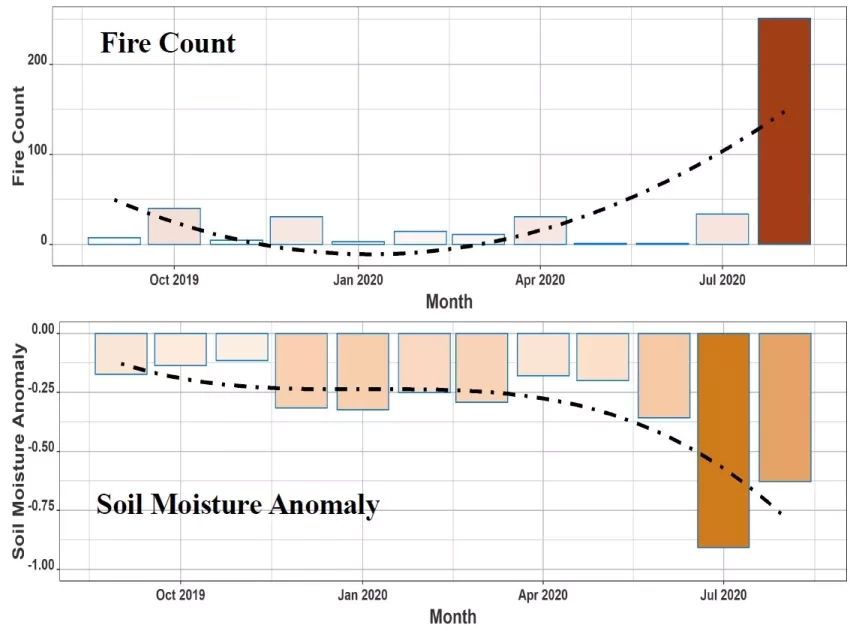
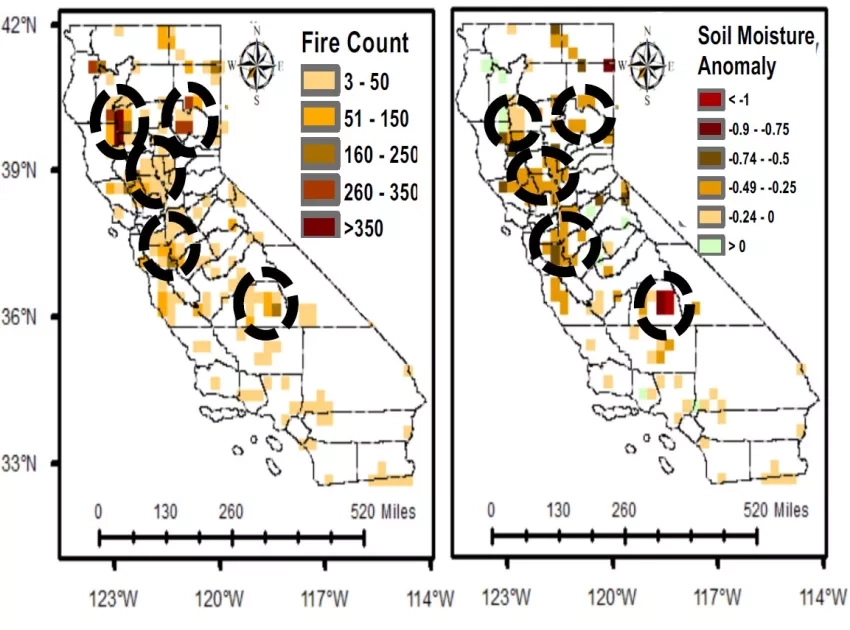
California experienced an unprecedented number of fires in August 2020, which is corroborated by satellite-based fire detections from the Moderate Resolution Imaging Spectroradiometer (MODIS) instruments aboard NASA's Terra and Aqua satellites. Researchers compared the amount, location, and timing of the MODIS fire detections, with SMAP root-zone soil moisture anomalies (the amount that current soil moisture conditions, at the depth of plant roots, deviate from the historical average), and found a strong correlation between the timing and location of low soil moisture conditions and an increase in fires. In general terms, this indicates that fires are more likely to occur in drought-affected areas and during dry seasons.
Dry soil is linked to more fires, but fires can also cause dry soil - which can affect soil water availability for agriculture, negatively impacting crop health and production. These satellite-based soil moisture and fire observations can aid local governments and response agencies in better anticipating and preparing for an active fire season, and aid in tracking the potential impact of fire on soil water availability and crop production.
The researchers obtained soil moisture data from the Google Earth Engine-based NASA-USDA SMAP global soil moisture product which provides soil moisture information across the globe at 0.25°x0.25° spatial resolution. This data set includes surface and subsurface soil moisture (mm), soil moisture profile (%), surface and subsurface soil moisture anomalies (-). MODIS fire data was obtained from the NASA Earth Observations website (https://neo.sci.gsfc.nasa.gov/), then loaded into Google Earth Engine to perform the analysis. This cloud-based data analysis enabled by the NASA / Google Earth Engine partnership demonstrates the value of concurrent satellite-based measurements for mapping, monitoring, and assessing regional fire potential impact and susceptibility.