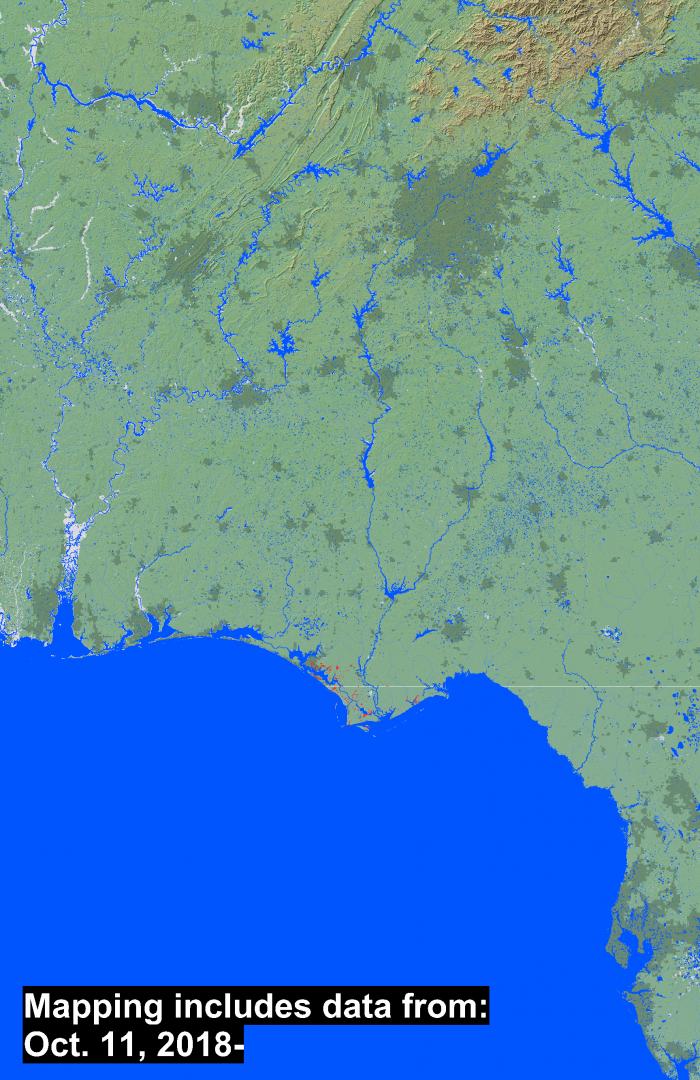
The picture above is a flooding map created by Professor Robert Brackenridge at The University of Colorado. The data to create this map was derived from The European Space Agency (ESA) Copernicus Sentinel-1 satellite. Sentinel-1 is a two satellite constellation with the prime objectives of Land and Ocean monitoring. Sentinel-1A and Sentinel-1B satellites carry the single C-band Synthetic Aperture Radar (SAR) instruments, which can provide an all-weather, day-and-night supply of imagery of Earth's entire surface every 6 days.
The map shows flooding in Florida from Hurricane Michael. Areas in red are flooding mapped from the Copernicus Sentinel-1 SAR data provided by the ESA. Areas in blue are covered by normal water extent for reference. Areas in light gray are all previously mapped flooding since 1999. Flooding maps help support decision making or other research applications.