Powerful Category 5 Hurricane Dorian struck the northern parts of the Bahamas on Sunday, September 1. Dorian first pummeled the Abaco Islands before stalling and battering Grand Bahama Island more than 40 hours with heavy rain and catastrophic storm surge. The National Oceanic and Atmospheric Administration’s (NOAA) GOES East satellite provided rapid, highly detailed imaging so that forecasters would have critical information about the storm’s movement. In the evening hours of September 2, the European Space Agency’s Sentinel-1A satellite also passed over the Bahamas, with a synthetic aperture radar (SAR) system capable of imaging the land surface through all but the most intense of Dorian’s rainfall bands to afford a view of what was occurring on the ground. The data was then processed by the Advanced Rapid Imaging and Analysis (ARIA) team at NASA’s Jet Propulsion Laboratory in collaboration with the European Space Agency, the California Institute of Technology and the Earth Observatory of Singapore.
View fullscreen on the NASA Disasters Mapping Portal
This interactive map from the NASA Disasters Mapping Portal displays a SAR-derived flood proxy map (FPM) for September 2nd, 2019 overlaid on GOES East imagery from the same time as the Sentinel-1A overpass. By moving the spyglass you can view flooded regions, which are shown in blue. The yellow box indicates the extent of the SAR data collected. With the help of Sentinel-1A, NASA scientists derived products to help identify the storm’s impacts on parts of the Bahamian island chain. These included a false-color composite from the Alaska Satellite Facility, the NASA Distributed Active Archive Center responsible for distributing SAR data.
View fullscreen on the NASA Disasters Mapping Portal
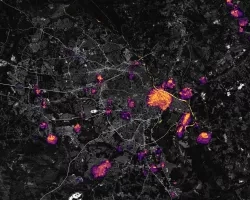
By comparing pre-event (August 21st, 2019, shown on the right) and post-event (September 2nd, 2019, shown on the left) imagery in this interactive map, flooding from the storm surge and rainfall of Hurricane Dorian can be seen as dramatic changes in the land surface coloration where additional shades of blue and red-orange appear. Land surface vegetation appears in green shades, smooth water surfaces in blue, and water surfaces roughened by high winds and waves appear in shades of orange. Scientists at NASA’s Jet Propulsion Laboratory also created a damage proxy map by identifying changes compared to pre-event conditions, refining detections of areas likely affected during Sentinel-1A observations.
As skies clear after the storm, GOES East’s geostationary imaging and multiple polar-orbiting NASA, NOAA, international, and commercial satellites will continue to map widespread flooding and damage. SAR sensors will continue to contribute to mapping as well, particularly helpful at imaging water hidden beneath dense vegetation.