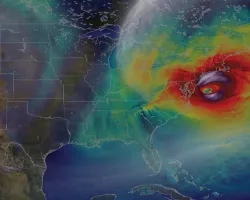
The GPM core satellite captured this first image of the storm at 5:44 UTC (12:44 am EST) Thursday January 4th, 2018 as the surface low was passing off Cape Hatteras, North Carolina. The image shows DPR (radar) surface precipitation rates in the center of the swath and GMI (microwave) rates in the outer swath overlaid on enhanced IR data from GOES-East. The DPR swath passed just northeast of the center of the surface low and over a portion of the storm’s occluded front. Midlatitude cyclones are associated with fronts, which define the boundaries between the different air masses where the storms form. Typically a slower moving warm front extends eastward from the storm’s center where warmer air is being pushed northward over colder air while a faster moving cold front wraps around the back side of the storm where denser, colder air is undercutting warmer air. If the cold front catches up to the warm front, an occluded front forms wherein the warm air is no longer at the surface and tends to happen in the more mature stages of the storm. GPM shows the classic comma shaped precipitation shield with weaker looking precipitation rates extending northwest of the storm’s center over the eastern third of North Carolina in the form of snow where the air is colder and much heavier rates (shown in orange and red) in the form of rain extending eastward from the center along the occluded front where warm moist air is being forced aloft sharply. Moderate rates (shown in green) off shore are also in the form of rain where the air is warmer. However, despite their weaker appearance relative to the rain offshore, at the time of this image, moderate to even heavy snow was being reported from central Virginia down through eastern North Carolina with moderate rain right along the coast.
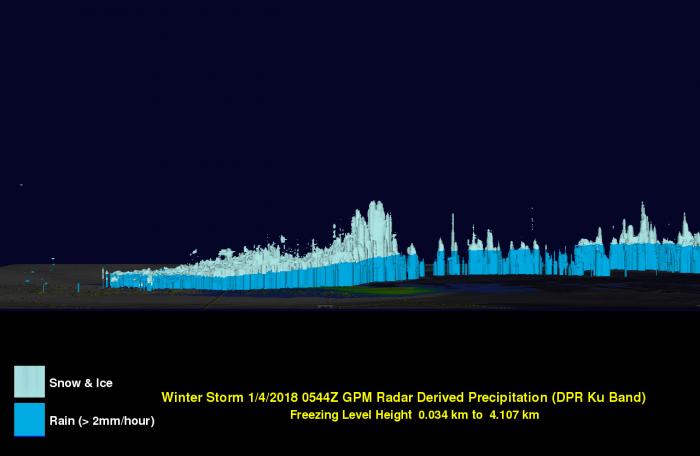
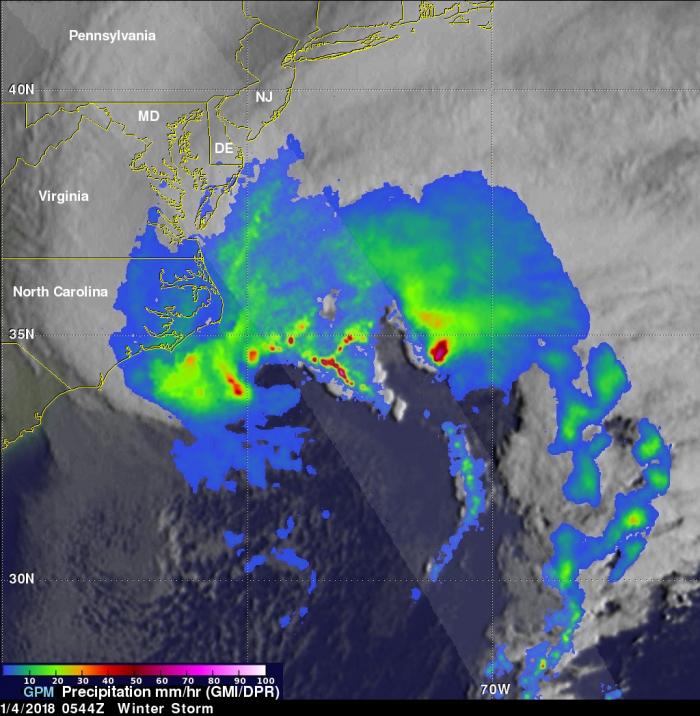
This next image shows a 3D cross section taken at the same time of 2 mm/hour precipitation rates through the storm looking east along the DPR swath. Rates in light blue indicate frozen precipitation and those in darker blue liquid (i.e., rain). The deeper towers in the center of the image are associated with the heavier surface rain rates in the previous image located along the occluded front and those on the far right with convection along the trailing cold front farther south. Although the DPR does not bisect the snow over coastal Carolina, it does show how shallow the precipitation is farther north (left side of the image) where the freezing level is much closer to the surface. This corresponding 3D animation provides a unique perspective of the precipitation structures associated with the storm from deep convective towers in the warm sector to the shallower but broad precipitation shield extending northwest over colder air.
At the time of this image, the National Weather Service (NWS) analyzed the storm’s central pressure as 972 mb, which is on par with a Category 1 hurricane and already 32 millibars deeper than it was just 12 hours earlier, which already qualifies it as “a bomb”. Also much like a hurricane or tropical storm, precipitation amounts are closely tied to how quickly the storm progresses. The orientation of the upper-level trough over the eastern half of the country is expected to keep Grayson moving along, thus moderating snowfall accumulations, which are expected to be higher over New England and the Canadian Maritimes. However, the storm is expected to continue to deepen and bring hurricane force winds to parts of New England, including Mount Washington and the coastal waters of New England, as well as extreme wind chills to much of the Northeast as the next wave of Arctic air moves in behind the storm.