NASA and its partners are contributing observations and expertise to the ongoing response to the Aug. 23, 2016, magnitude 6.2 Amatrice earthquake in central Italy caused widespread building damage to several towns throughout the region. This earthquake was the strongest in that area since the 2009 earthquake that destroyed the city of L'Aquila.
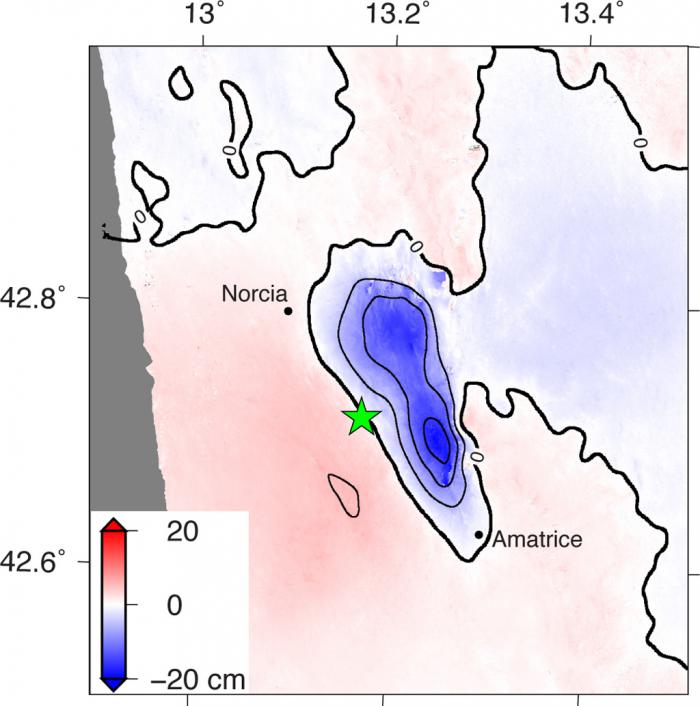
Scientists with the Advanced Rapid Imaging and Analysis project (ARIA), a collaboration between NASA's Jet Propulsion Laboratory, Pasadena, California, and the California Institute of Technology in Pasadena, analyzed interferometric synthetic aperture radar images from the PALSAR-2 instrument on the ALOS-2 satellite operated by the Japan Aerospace Exploration Agency (JAXA) to calculate a map of the deformation of Earth's surface caused by the quake. This false-color map shows the amount of permanent surface movement, as viewed by the satellite, during a seven-month interval between two ALOS-2 images acquired on Sept. 9, 2015 and Aug. 24, 2016. The movement was caused almost entirely by the earthquake.
In this map, the colors of the surface displacements are proportional to the surface motion. The red and pink tones show the areas where the land moved toward the satellite by up to 2 inches (5 centimeters). The area with various shades of blue moved away from the satellite, mostly downward, by as much as 8 inches (20 centimeters). Contours on the surface motion are 2 inches (5 centimeters) The green star shows the epicenter where the earthquake started as located by the U.S. Geological Survey National Earthquake Information Center. Black dots show town locations.
Scientists use these maps to build detailed models of the fault slip at depth and associated land movements to better understand the impact on future earthquake activity. The map shows the fault or faults that moved in the earthquake is about 14 miles (22 kilometers) long between Amatrice and Norcia and slopes to the west beneath the area that moved downward. The PALSAR-2 data were provided by JAXA through a science project.
The KMZ file for viewing the radar measurement image in Google Earth is available at http://aria-share.jpl.nasa.gov/events/20160824-Italy_EQ/.
For more information about ARIA, visit: http://aria.jpl.nasa.gov.