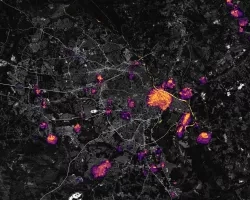
Scientists with the Advanced Rapid Imaging and Analysis project (ARIA), a collaboration between NASA’s Jet Propulsion Laboratory in Pasadena, California, and Caltech, also in Pasadena, using synthetic aperture radar (SAR) data from the European Union’s Copernicus Sentinel-1A and -1B satellites, operated by the European Space Agency, generated a map of the deformation of Earth’s surface caused by the Aug. 5, 2018 magnitude 6.9 earthquake under Lombok island, Indonesia. The deformation map is produced from automated interferometric processing of the SAR data using the JPL-Caltech ARIA data system in response to a signal received from the U.S. Geological Survey. The false-color map shows the amount of permanent surface movement that occurred almost entirely due to the quake, as viewed by the satellite, during a 6-day interval between two Sentinel-1 images acquired on July 30 and Aug. 5, 2018.
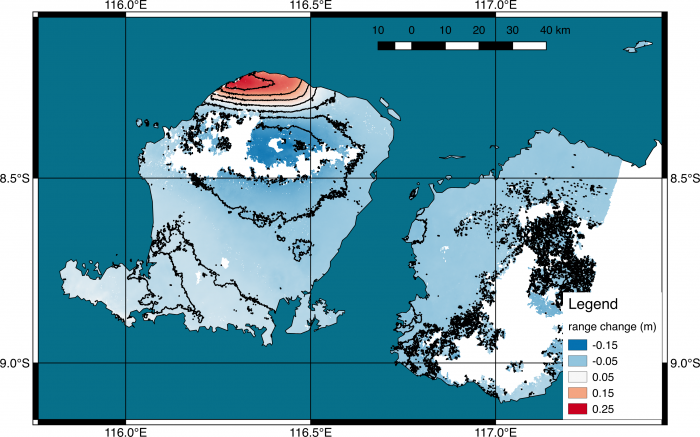
The map shows that the earthquake fault was under the northwest corner of Lombok island, probably extending offshore to the west. Through these maps, NASA and its partners are contributing important observations and expertise that can assist with response to earthquakes and other natural or human-produced hazards.
From the pattern of deformation in the map, scientists have determined that the earthquake fault slip was on a fault beneath the northwestern part of Lombok Island and caused as much as 10 inches (25 centimeters) of uplift of the ground surface. The map depicts motion towards the satellite (up and west) in the direction of the radar’s line-of-sight, with contours every 2 inches (5 centimeters). White areas are places where the radar measurement was not possible, largely due to dense forests in the middle of the islands.