Published
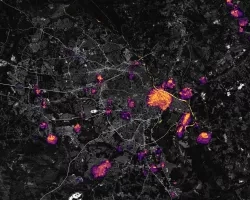
This animation depicts the flooded areas of Texas from August 25th – August 27th 2017 at 9km resolution and 3 hour intervals. The product shown is derived from SMAP data with a new algorithm developed by the post-flood crop damage assessment project (RF-CLASS system) funded the NASA Earth Science Disatsers Program. Please note this is an experimental product without full validation.