The state of California has been suffering from a multi-year drought that has severely depleted water resources and reservoir levels. Recent winters have failed to produce precipitation and mountain snows to replenish the losses during the dry summers. However, the situation has rapidly changed this winter, particularly in the past week when multiple atmospheric rivers have impacted the state.
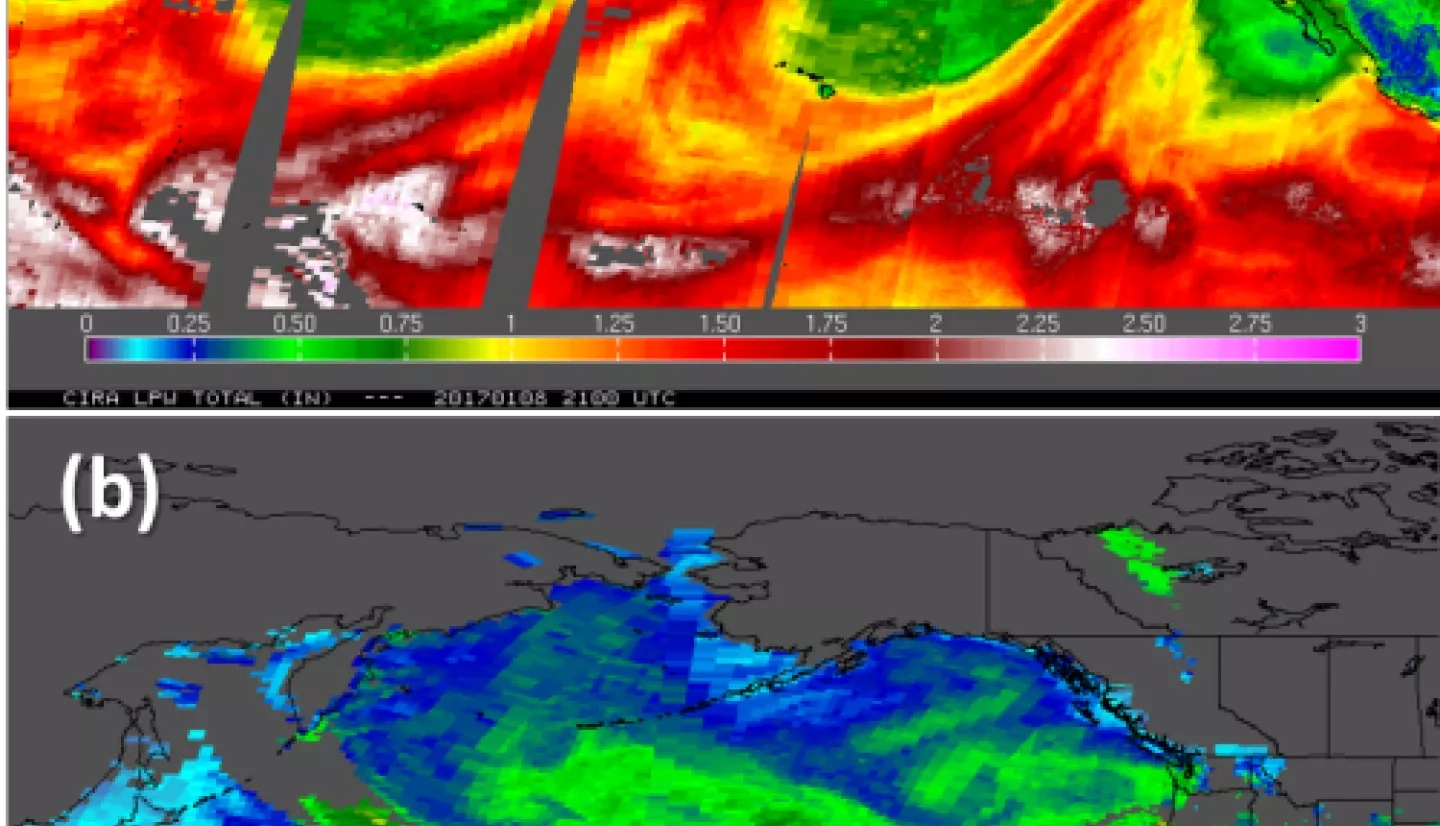
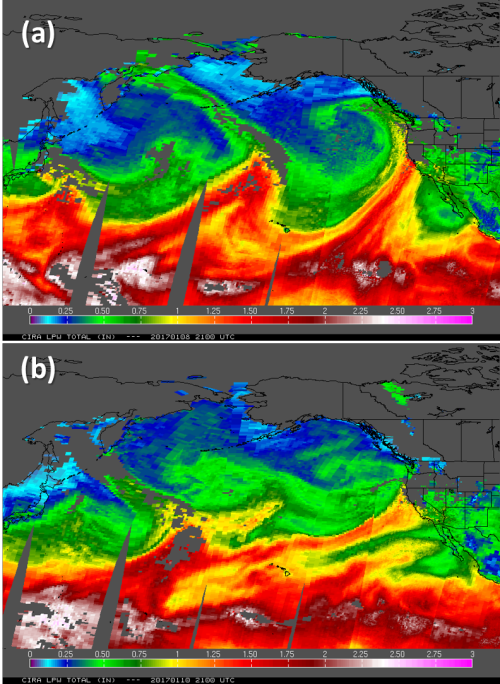
An atmospheric river is a concentrated channel of deep moisture that is transported from the tropical Pacific Oceanic regions to the West Coast of the United States. These events are often associated with prodigious amounts of rainfall and mountain snows that lead to flooding, mudslides, and avalanches. We have seen such events this past week impact California, especially the central and northern parts of the state. CIRA’s total precipitable water product in Figures 1a and 1b depict two separate atmospheric rivers impinging on central California from 8 and 10 January 2017, respectively. The first wave transported a plume of tropical moisture from the south-southwest, which led to massive rainfall and high snow levels. The second atmospheric river on the 10th was less directly connected to the tropics (coming in from the west-southwest), but nonetheless exhibited a well-focused transport of high moisture content. Widespread flooding and mountain avalanches have resulted from these moisture plumes as the impacted California, as well as dramatic replenishment of reservoirs.
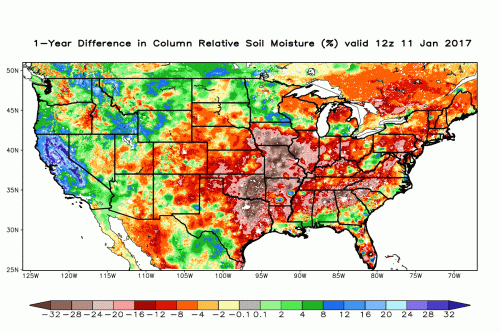
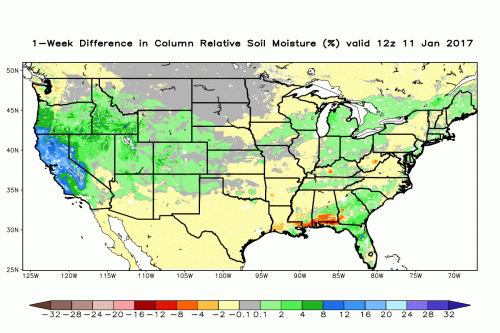
SPoRT’s real-time instantiation of the Land Information System (aka “SPoRT-LIS”) has nicely depicted the substantial replenishment of the moisture content in the soils over California. The SPoRT-LIS is an observations-driven, ~3-km resolution run of the Noah land surface model that consists of a 33-year climatology spanning 1981-2013, and real-time output at hourly intervals sent to select NOAA/NWS partnering forecast offices. The one-year change in the SPoRT-LIS total column soil moisture at 1200 UTC 11 January (Fig. 2) shows large increases over most of California, particularly in the higher terrain (given by blue and purple shading). [At the same time, annual degradation in soil moisture can be seen across the central and eastern U.S.] Interestingly, a substantial portion of California’s annual soil moisture increases has occurred in just the past week (Fig. 3; SPoRT-LIS total column soil moisture change over the past week). One can certainly see the important role that atmospheric rivers play in being “drought busters”!
A map of the SPoRT-LIS daily soil moisture percentiles from 11 January highlight the very wet anomaly over California relative to the 33-year soil moisture climatology (Fig. 4; similar to the pattern of annual soil moisture change from Fig. 2). Blue shading denotes greater than or equal to the 98th percentile, thus indicating unusually wet soils on the tail end of the historical distribution.

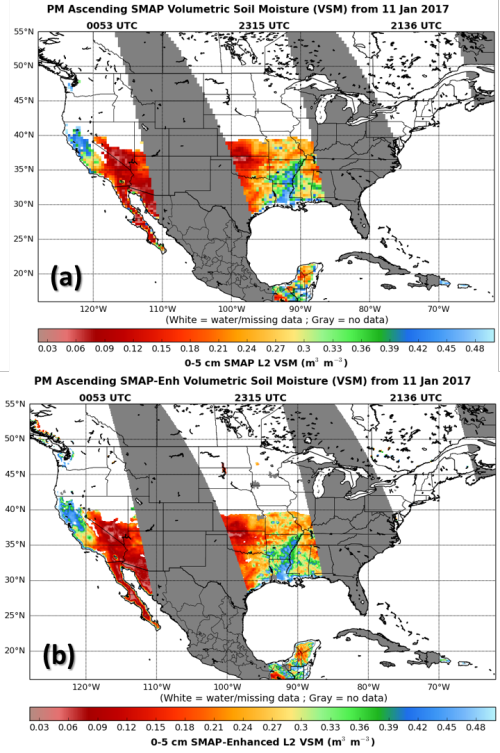
Finally, SPoRT is acquiring and assimilating in real time the Soil Moisture Active Passive (SMAP) Level 2 (L2) retrievals produced by NASA/JPL into an experimental version of the SPoRT-LIS. SPoRT is a SMAP Early Adopter and has a funded project to conduct soil moisture data assimilation experiments with LIS and evaluate impacts on land surface and numerical weather prediction models. Figure 5 shows SMAP L2 retrievals of the evening overpasses from ~0000 UTC 11 January. Panel (a) is the 36-km resolution radiometer product, while panel (b) shows the enhanced-resolution product, obtained from the SMAP radiometer by using Backus-Gilbert optimal interpolation techniques to provide data on a finer (9 km) grid. The enhanced-resolution product provides much more detail of the wet soils in California, while retaining the same overall regional patterns as the original 36-km retrieval. Given the loss of the active radar component of the SMAP mission, SPoRT plans to assimilate both the 36-km and 9-km products separately, and compare results on model accuracy.