“A picture is worth a thousand words” is a saying largely undisputed in its accuracy. There’s a reason several different languages and cultures have a version of this popular idiom. Graphics can convey in seconds what words need much more time to say. When disasters strike, every minute and second becomes incredibly precious. During critical times, geographic information systems (GIS) become indispensable in disseminating data in a way everyday people can quickly understand.
A Geographic Information System (GIS) is a system that can map and examine changes on Earth by analyzing and displaying spatially related data from various data sources. Geospatial data from various sources, such as satellite imagery, GPS data and descriptive information associated with a specific location, can be integrated and collectively analyzed using GIS.
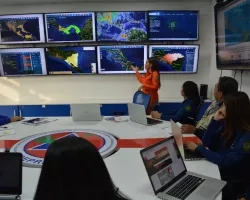
“I manage the NASA Disasters Mapping Portal which hosts all of our GIS services, maps, applications, and Story Maps that we share with stakeholders before, during, and after responses or disasters,” says Garrett Layne, GIS Lead for NASA’s Earth Applied Sciences Disasters program area. The Disasters Mapping Portal is the geospatial hub of NASA disaster data. With free and openly available data, it caters to GIS and remote sensing users of all levels. “Many stakeholders in the emergency and disaster management communities are not familiar with satellite data and how to use it. The portal allows us to provide satellite data products in a format that these stakeholders are already familiar with and allows us to demonstrate and explain what NASA can produce and how they may be able to use it for their response.”
This summer, Layne joined colleagues in the Disasters program area and others from across NASA’s Earth Science Division at the 42nd Esri User Conference in San Diego, California. The annual gathering of GIS professionals has grown from a handful of users in 1981 to over 14,000 in-person visitors, and tens of thousands attending the conference virtually this year. That growth reflects the increasing importance of understanding the advancements and capabilities of GIS-enabled mapping and spatial analytics software over the past four decades.

Layne hosted over 100 guests in a meeting at the Esri conference to introduce new users to the NASA Disasters program area and the Disasters Mapping Portal. The meeting allowed NASA to connect with new stakeholders and get direct and immediate feedback. A broader Earth Science meeting highlighted new ways NASA is using GIS to make its data more accessible and user-friendly. The audience was not just emergency management and disaster response professionals, but the larger GIS community as well. Brady Helms, Disaster Management Coordinator at NASA Headquarters, explains, “A lot of our work there was to show what’s possible, what NASA’s Disasters program area and Earth Sciences as a whole can do for users around the world.”
NASA AND ESRI
The conference also provides an opportunity for NASA and Esri’s GIS experts to connect. The two organizations have collaborated to develop new applications using NASA data and expand the utility of the Disasters Mapping Portal. Layne notes, “We’re working on a few capabilities. One is automated image services using synthetic aperture radar (SAR). We work with Esri to set up those services so we can provide (imagery) in as close to a real-time fashion as possible.” NASA Disasters researchers are also developing cutting-edge flood risk projects, and the Disasters GIS team is always trying to broaden the scope of what can be accomplished with GIS and the portal.
GIS AND DISASTER MANAGEMENT
During the 2020 Western U.S. wildfire season, GIS technology and the Disasters Mapping Portal proved beneficial as numerous wildfires burned simultaneously across California. With so many active fires, satellite data could help local emergency management agencies identify and prioritize their responses during a period where their resources were stretched thin." “We provided information on active fire points, as well as fire modeling, smoke plumes, and air quality,” said Helms.
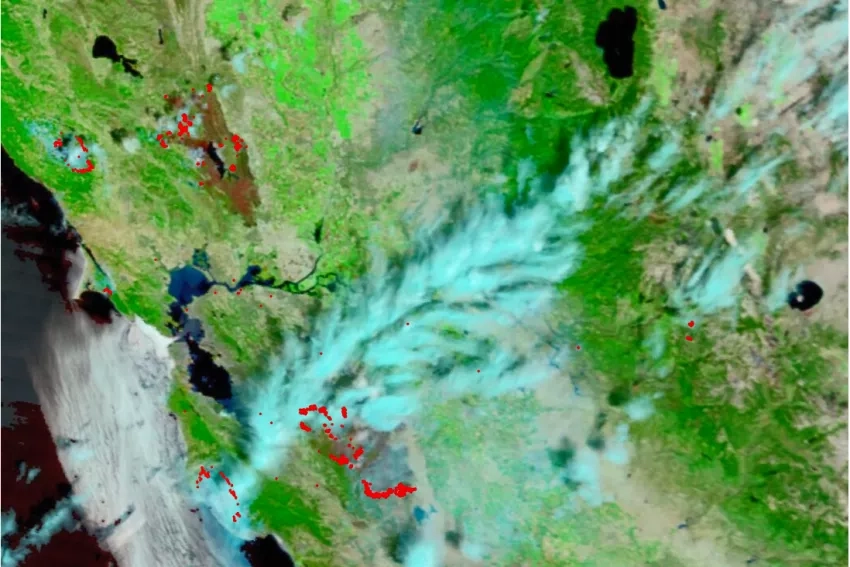
NASA used GIS to develop and provide graphics and maps through the portal to give additional perspectives and help disaster coordinators – and, ultimately, response agencies – understand resource needs. That data and easy-to-understand information enable a sense of the “big picture,” which leads to insights that can help manage resources and reduce loss.
“That's the other side of how our data is helpful; it can help show what we call ‘cascading events,’” explains Helms. “So obviously, a fire is a hazard in and of itself. When that fire is finally put out, if you were to have major rainfall immediately after the fire, you would have (mud and ash) debris flow. Understanding where the most intense fire was, understanding the most severely burned areas can help you prepare for the cascading impact of such debris flows.”
Helms continues, “If there's no human impact, it's not really a ‘disaster,’ it's nature taking its course. With people involved, THAT is the disaster. Lives have been upended. Our goal is to be able to provide information to inform the whole cycle of emergency management before, during, and after an event. That can help connect the dots between events – to provide a comprehensive ‘picture’ that leads to understanding and future resilience to similar natural hazards.”