
New Jersey is the most densely populated state in the United States with nearly nine million people. The Garden State has seen a wide range of wild weather, including destructive nor’easters, frigid blizzards, tornadoes and hurricanes.
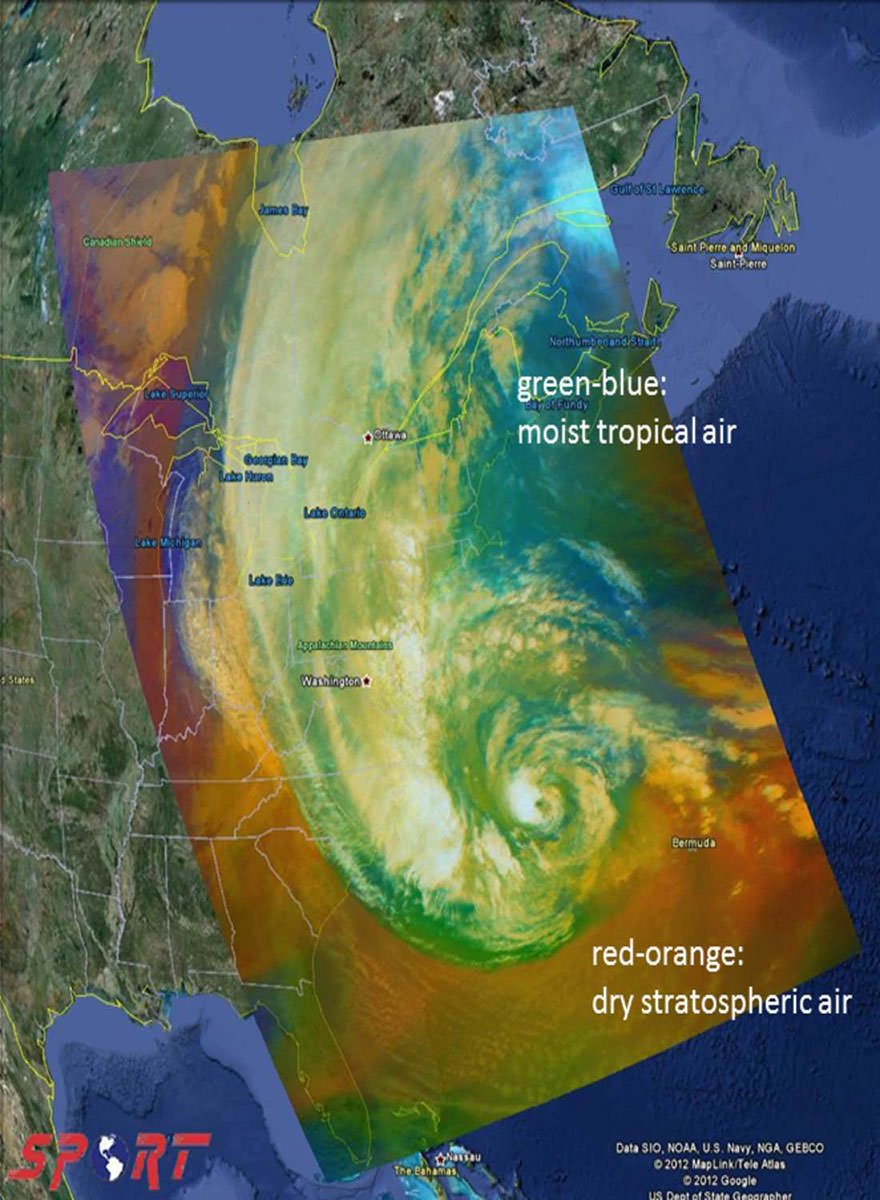
In October 2012, one of the largest recorded hurricanes hit New Jersey. More than 1,000 miles (1,600 kilometers) in diameter at one point, Hurricane Sandy moved along the East Coast with the Jersey Shore in its crosshairs
“[The kind of products SPoRT supplies] should be routinely produced for major disasters as an easy reference for power outages and as a recovery indicator.”
–Brenda Jones, U.S. Geological Survey
Even before Sandy began lashing the United States, NASA’s Short-term Prediction Research and Transition Center (SPoRT) was gathering satellite imagery and data to help forecasters better predict the storm’s path and intensity. NASA established SPoRT in 2002 to facilitate the use of real-time Earth-observations for short-term weather forecasting.
"SPoRT has been transitioning unique NASA and NOAA [National Oceanic and Atmospheric Administration] research satellite data to numerous National Weather Service forecast offices … to help them improve short-term weather forecasts of hazardous weather conditions like Hurricane Sandy,” explained Andrew Molthan, a research meteorologist with SPoRT. “We work closely with end users to understand their forecast problems and match our data capabilities to those problems."
When Sandy made landfall in New Jersey as a weaker post-tropical cyclone, it was devastating. It’s estimated that Sandy caused $70 billion in damage in the United States, causing scores of casualties across nine states. In New Jersey, the storm took more than 30 lives and damaged or destroyed at least 340,000 homes. Approximately 2.5 million customers lost power – the highest number of outages reported from any state.
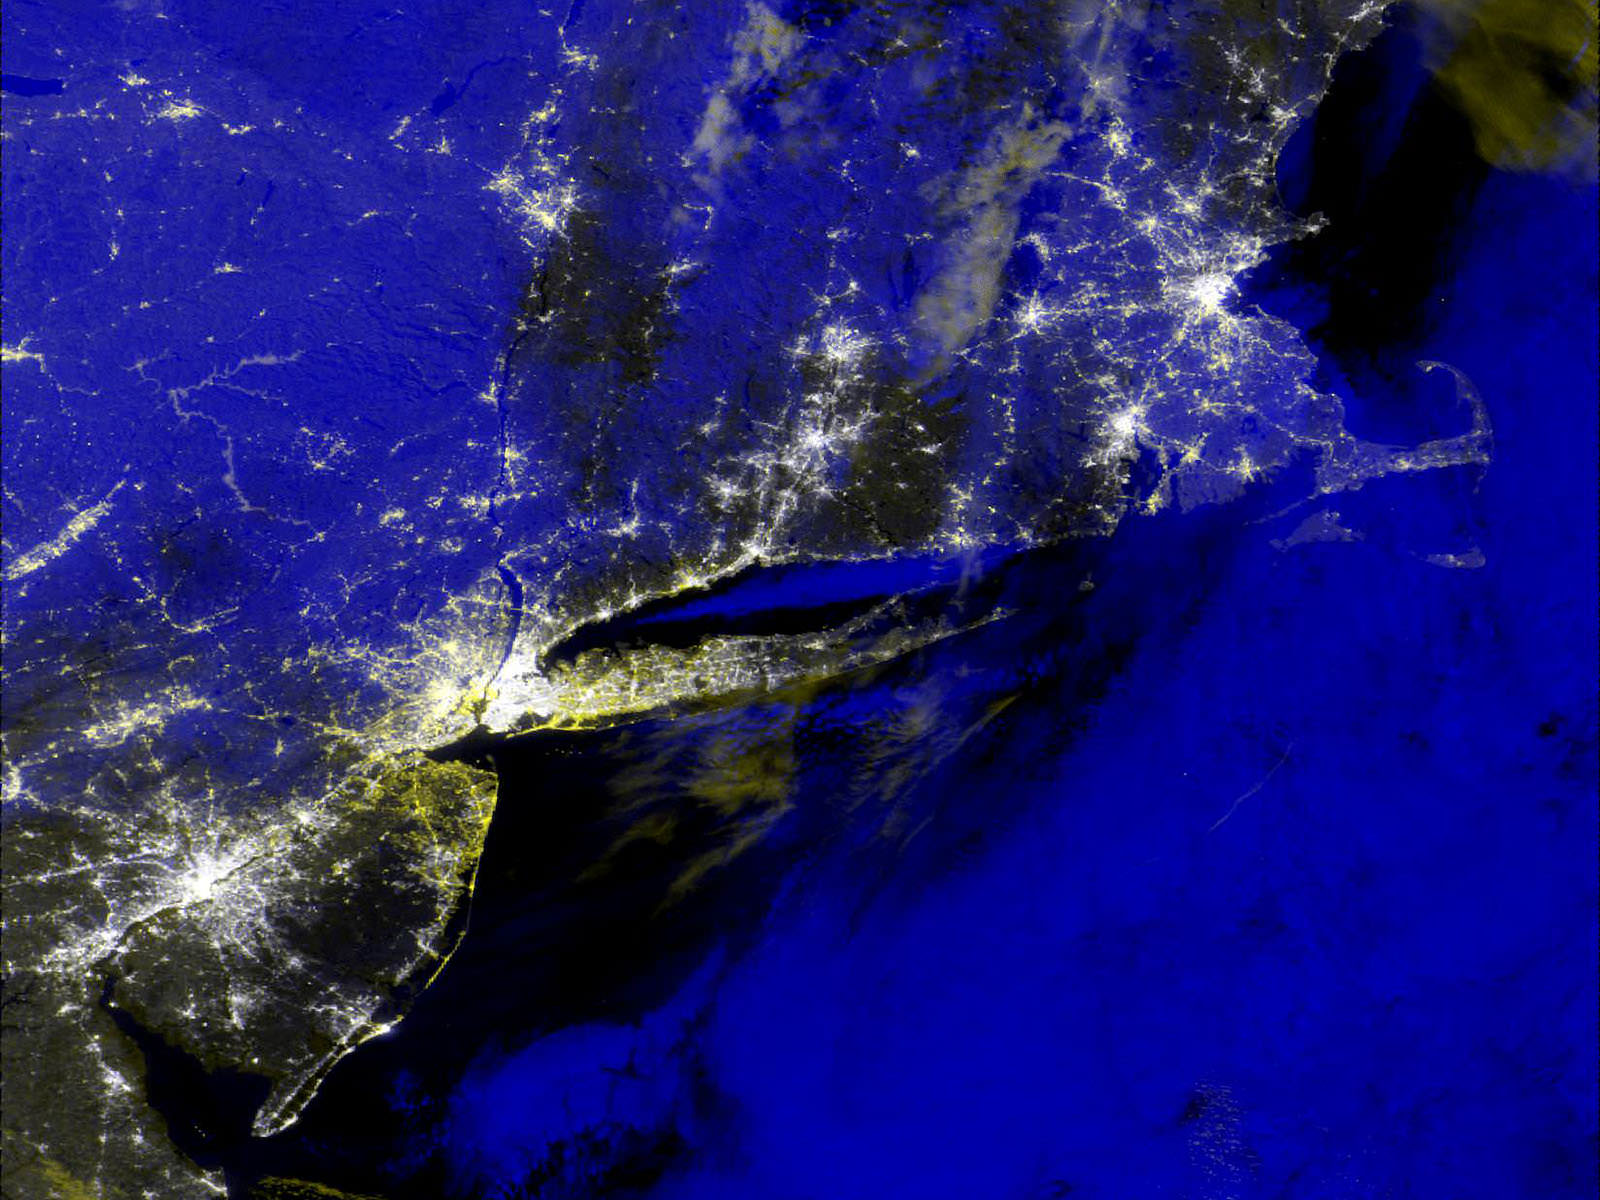
In the immediate aftermath, the SPoRT team rapidly developed a prototype “blackout composite” from near real-time satellite data. The team identified differences between satellite images of pre-storm lights on the ground and images of lights still visible just after Sandy. SPoRT supplied the blackout composites and satellite imagery to the U.S. Geological Survey (USGS), the Federal Emergency Management Agency (FEMA) and others.
Determining what parts of New Jersey lost power was a key part of the post-hurricane response from FEMA, the U.S. Army Corps of Engineers and the U.S. Army. They used SPoRT products from the portals to monitor areas without power as part of their response and support. The wide-ranging imagery allowed emergency managers to organize and allocate personnel, equipment and supplies, and to initiate recovery efforts quickly in areas in most need of assistance. For example, the U.S. Army Northern Command used SPoRT data to select staging locations for generators.
In addition, the SPoRT team used NASA satellite data to assist in disaster assessments. Using observations from the Terra satellite, the team produced false-color composites – which differentiate vegetated surfaces from non-vegetated areas – to identify damaged roads and homes across the affected states and particularly in New Jersey. Responders accessed these data products from the USGS data portal as well.
For Lt. Col. David Foster of the U.S. Army, those portal products were critical for his troops’ role in disaster response. As he told SPoRT, “We are pushing an additional analysis team into New Jersey to support our Joint Coordination Element … Your data is one of the invaluable data sets they have and will be leveraging.”
Brenda Jones, a disaster response coordinator with USGS, also added that the kind of products SPoRT supplies “should be routinely produced for major disasters as an easy reference for power outages and as a recovery indicator.” Providing this much-needed, timely data to forecasters and first responders is at the core of SPoRT’s mission. Molthan said, "There are many [satellite] images of Sandy available on the web … But SPoRT provides the National Weather Service with [Earth-observing] data directly within their decision support systems, allowing use with all of their other tools. SPoRT creates a number of unique value-added products not available anywhere else."
This story is part of our Space for U.S. collection. To learn how NASA data are being used in your state, please visit nasa.gov/spaceforus.