Researchers have known that New Orleans is sinking, which has made the city especially vulnerable to flooding. By the time Hurricane Katrina struck in August of 2005, parts of the city were already up to 5 meters below sea level. To track the rate of sinking land, which is also called subsidence, scientists have turned to remote-sensing data.
In one study, published in the journal Nature, a team looked at images from the Canadian Space Agency’s RADARSAT-1 mission that was launched with NASA’s help in 1995. The satellite’s primary instrument was a Synthetic Aperture Radar (SAR) sensor, which captures detailed imagery of Earth by transmitting and receiving microwave signals to "see" through clouds, dust, smoke and darkness. SAR images obtained of the same area over time can also allow researchers to observe surface-height changes with millimeter-level precision.
The researchers found that in the three years leading up to the historic Hurricane Katrina storm, most of New Orleans subsided 8 millimeters per year relative to global mean sea level. But some areas sank a lot deeper, some as much as 28.6 millimeters, or just over an inch, of subsidence each year between 2002 and 2005.
One such area was near the Mississippi River–Gulf Outlet canal. During Katrina’s peak storm surge, water overtopped the levees around the canal. The team found a link between the location of breach points and the high rate of subsidence beneath these levee sections. This ground underneath the levees had lost a meter or more in elevation since their construction in the 1960s.
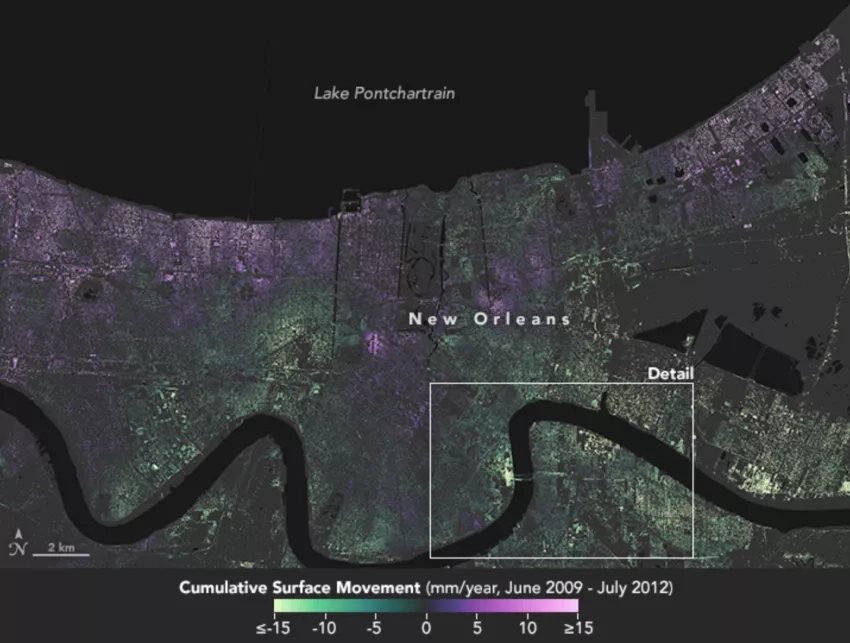
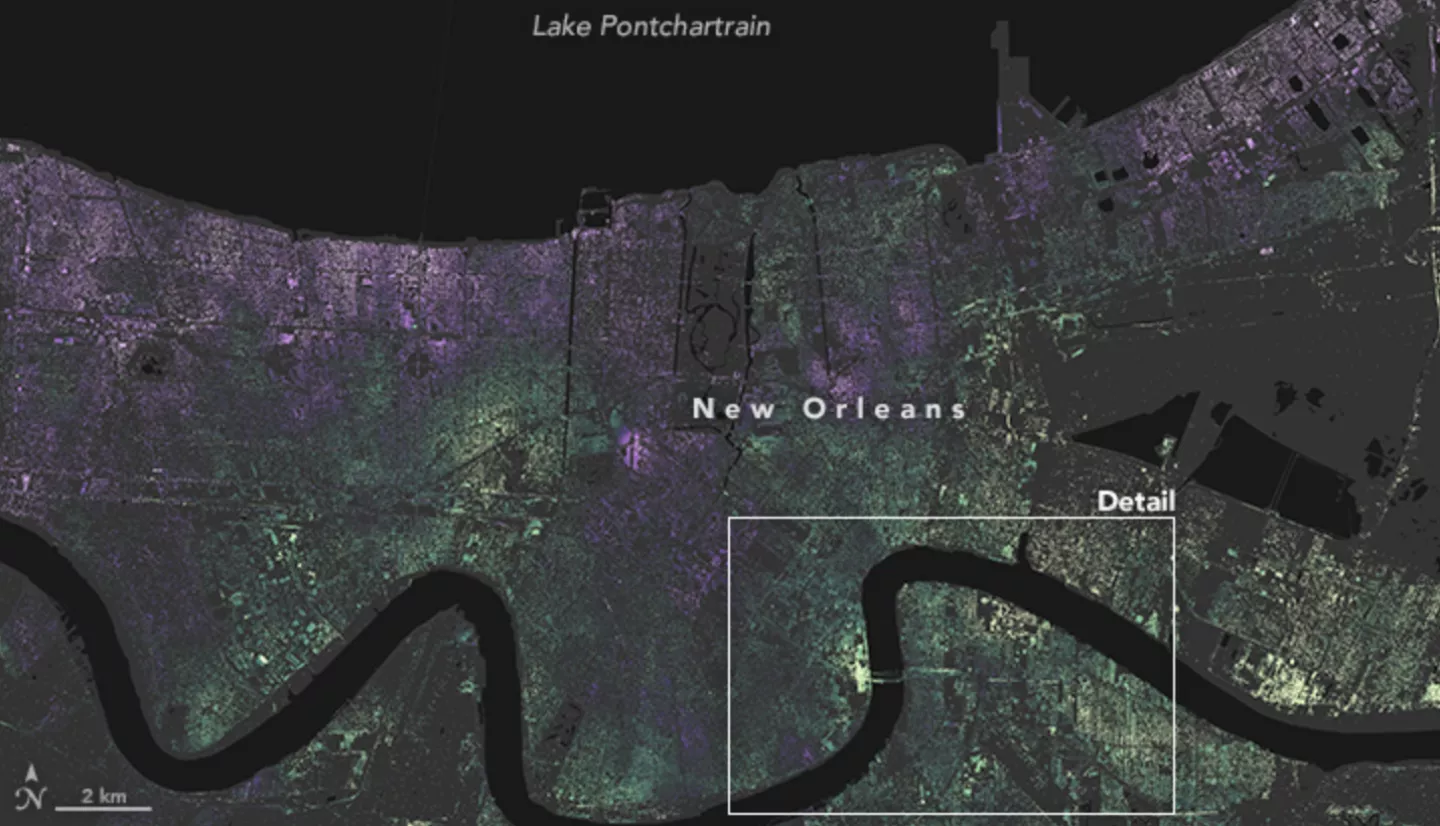
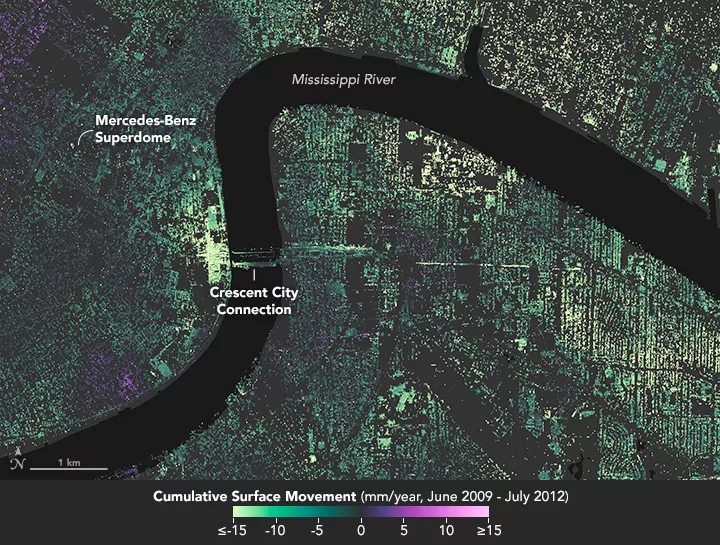
In another study, published in the Journal of Geophysical Research: Solid Earth, a NASA-led team found even more dramatic subsidence rates in the city between June 2009 to July 2012. These researchers also used SAR data, though for this study the imagery was captured by NASA's Uninhabited Aerial Vehicle Synthetic Aperture Radar (UAVSAR), which is mounted to an aircraft and flown repeatedly over a research area.
The scientists found up to 2 inches, or 50 millimeters, of yearly sinking in major industrial areas along the Mississippi River—in Norco, west of the city, and in Michoud, to the east. East of Norco lies the Bonnet Carré Spillway, which is New Orleans' last defense against springtime river floods. The researchers found up to 1.6 inches a year of sinking in areas behind the spillway.
"The more recent land elevation change rates from this study will be used to inform flood modeling and response strategies, improving public safety,” said the study’s lead author, Cathleen Jones, a radar scientist with NASA’s Jet Propulsion Laboratory.
Radar data on the rate of subsidence not only serves to inform decision makers but could also help scientists investigate reasons why New Orleans is sinking. Natural phenomena in the geology of the area, such as the slumping of the Michoud fault, cause some sinking. But human activities—such as draining wetlands, diverting sediment-bearing floodwaters from the Mississippi River and pumping groundwater—are also responsible.
Read more: Scientists Improve Maps of Subsidence in New Orleans