The U.S. is predicting droughts sooner with satellites
Unlike us humans, soybeans and wheat can’t turn to acupuncture or aromatherapy when they’re stressed out.
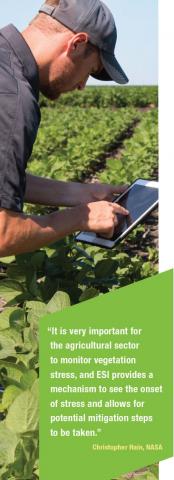 And, yes, plants can certainly feel stress. Stress that’s caused by too little moisture and exacerbated by high temperatures. “Agricultural stress occurs when crops do not have adequate soil water during their growth cycle,” explained agricultural researcher Christopher Hain. “Even if the stress doesn’t lead to failure of the crop, it can have significant impacts on end-of-season yield.”
Now a new tool is letting the U.S. agriculture community tap into space-based data to see this stress before it takes its toll.
Heads Up
Kyle Schell, a family rancher near Wall, South Dakota, knows how quickly fortunes can change for his business. “When droughts or flash droughts hit, and we as managers do not make adjustments, we start to do detrimental things to the ranch resource,” he said. “Having a good idea when these droughts are coming gives us the opportunity to make adjustments early, in order to not adversely affect the grass and hay acres.”
Providing that critical information sooner was the focus of an Applied Sciences project which used Earth observations to detect drought conditions across North America at a much earlier stage. Working with the Atmosphere-Land Exchange Inverse model, Hain and a team of scientists from NOAA, USDA-ARS, the National Drought Mitigation Center, and the University of Maryland integrated land-surface temperature measurements from the GOES satellite with vegetation, albedo, and landcover data from Terra and Aqua. The result was the development of a tool called the Evaporative Stress Index (ESI), which in many cases can indicate the beginnings of a drought two-to-four weeks earlier than current drought indicators.
What’s the benefit from adding the space-based data? They allow the ESI to assess moisture conditions on the ground—independent of precipitation. And that means the ESI can show how crops are responding to irrigation. It also means that the ESI is especially helpful for predicting a phenomenon called flash droughts. Unlike typical droughts that can take months or years to develop, flash droughts occur much more suddenly and can damage crops in a matter of weeks— well before the stress causes visible signs of damage.
“When vegetation is already turning brown, it’s too late,” Hain emphasized.
“New tools and products like the ESI will help our nation’s drought early-warning capacity, which can then help communities detect flash droughts as they come on quickly.” Mark Svoboda, U.S. Drought Monitor
Another Source
The ESI became operational in 2016 as a part of NOAA’s online GOES Evapotranspiration and Drought Product System. This decisionsupport system supplements information sources already available to the water resource and agriculture communities, such as the U.S. Drought Monitor.
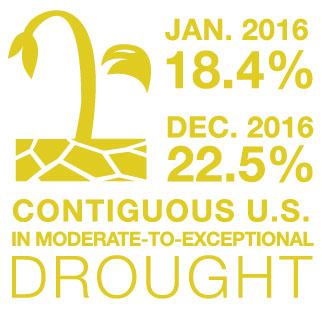
David Ollila, a sheep field specialist for South Dakota State University Extension, remarked how the ESI saw the first glimpses of a spring flash drought—much sooner than the Drought Monitor did. “This tool appears to provide a much quicker and more representative reflection of what is happening,” he noted. “The lag time in which the Drought Monitor recognized the severity of this year’s drought negatively impacted the ability for USDA Farm Service Agency support and relief… until it was at a point of being too late. Forage production was measured at five-to-fifteen percent of a normal year. That is catastrophic.”

For Schell, the ESI provides another tool for weighing his options. “I will monitor all of the drought resources available, including ESI, and if certain thresholds are met by certain dates, a destocking practice will begin,” he explained. “For example, if we are belownormal in precipitation on May 1st and the Drought Monitor and ESI are indicating drought, I will sell some or all of our replacement yearling heifers.”
It’s not just cattle and corn that benefit from the ESI, either. A state agency is also turning to it for guidance. As senior hydrologist for the Texas Water Development Board (TWDB), John Zhu uses ESI data as both an early drought indicator and as a reference for TWDB’s short-term drought forecast. “I’ve found that ESI is particularly useful for our drought monitoring program…We want to know what kind of drought it is and how long it will last.”
Going Global
With the successes already seen from the ESI for North America, Hain and his team also focused on much larger scales. “We developed a new method to use MODIS and VIIRS land surface temperature so that we could produce a global ESI product from just a single sensor,” Hain said. “We’ll be developing an operational global ESI dataset which will serve a large group of engaged stakeholders.”
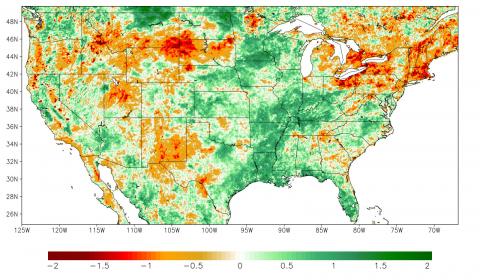
Initially, the stakeholders will include groups like the USDA Foreign Agricultural Service, the Global Drought Information System, and the GEOGLAM Early Warning Crop Monitor—and Hain is working on engaging more. “Ultimately our goal is to get global ESI datasets out to as many stakeholders as possible.”
Christopher Hain leads this project. In 2016, Hain moved to NASA Marshall Space Flight Center as a research scientist.
