Wildland Fire intern Katrina Sharonin reviewed the current state of NASA infrared imaging in how it is used to track wildfires. She is currently affiliated with NASA Wildland Fire Management and NASA’s Earth Information System.
For every major wildfire incident, precise information on fire perimeter size and rate of progression is critical for “incident personnel on where to concentrate their resources and assist in informing local people and media on the fire status,” that according to the National Interagency Fire Center. Several mapping methods are used to determine fire size and spread, including the use of GPS by walking/driving, image interpretation, and infrared flights.
Infrared data provides some of the most detailed information on fire progression and perimeters and is widely used by wildfire decision-makers to strategize and command firefighting resources.
Two main ways infrared imaging data is collected are aerial sensing and satellite imagery. Aerial sensing is the use of infrared sensors mounted on aircraft, primarily planes. An example of an aerial infrared sensor would be the NASA MODIS/ASTER (MASTER) Airborne Simulator, a payload that is integrated with aircraft and flown over fires. Large wildfires are typically too large to capture in one sensor flyover, so MASTER is typically flown over the fire several times in a series of parallel lines. The arrays of images are then “stitched” together to form a complete infrared image of the fire.
However, the final image composite is not typically sent straight to wildfire decision-makers and wildland firefighters, because composite imagery is difficult to interpret. As a result, agencies like the U.S. Forest Service employ infrared imaging interpreters to create geospatial information. These interpreters are often given the title of “IRINS.”
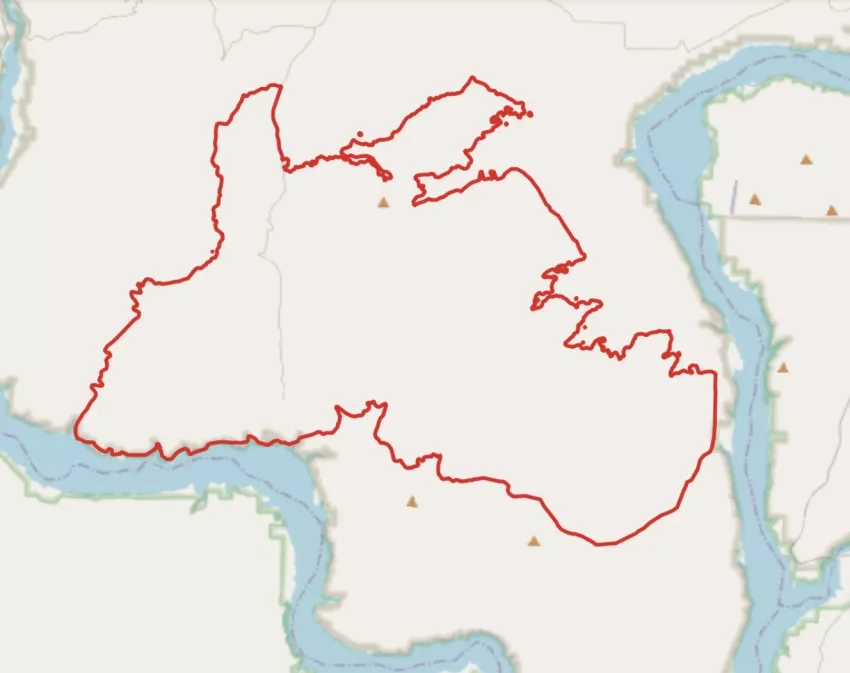
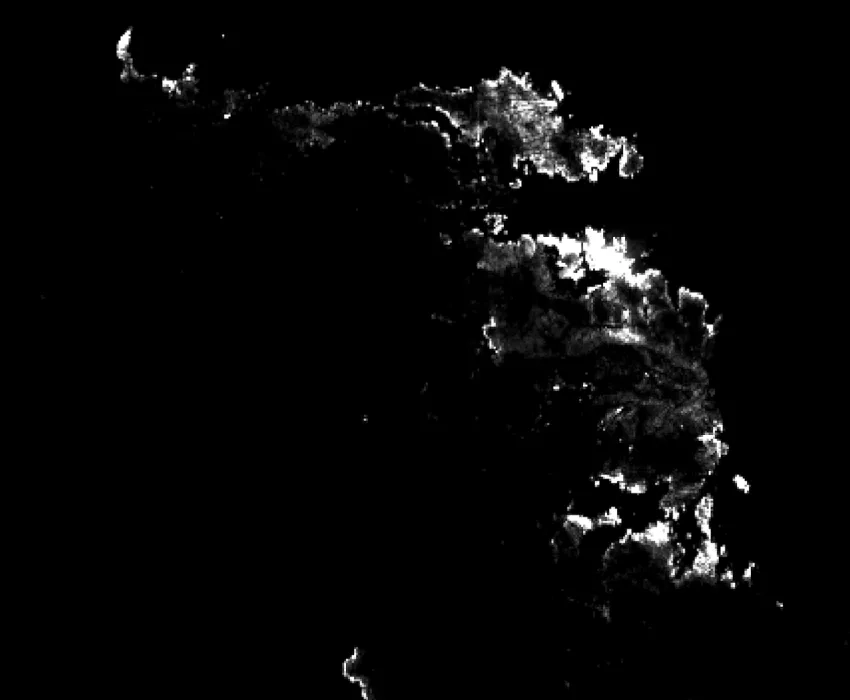
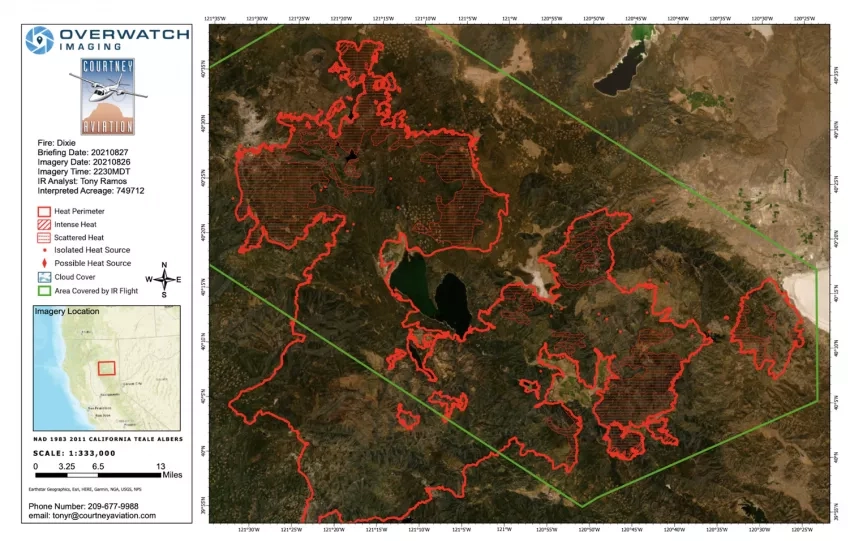
The figure below shows composite imagery from an aerial sensor versus an interpreted version, which forms a readable fire perimeter. For incident managers and firefighters, having easy-to-interpret products are critical due to the rapid and urgent pace of wildfire decision-making.
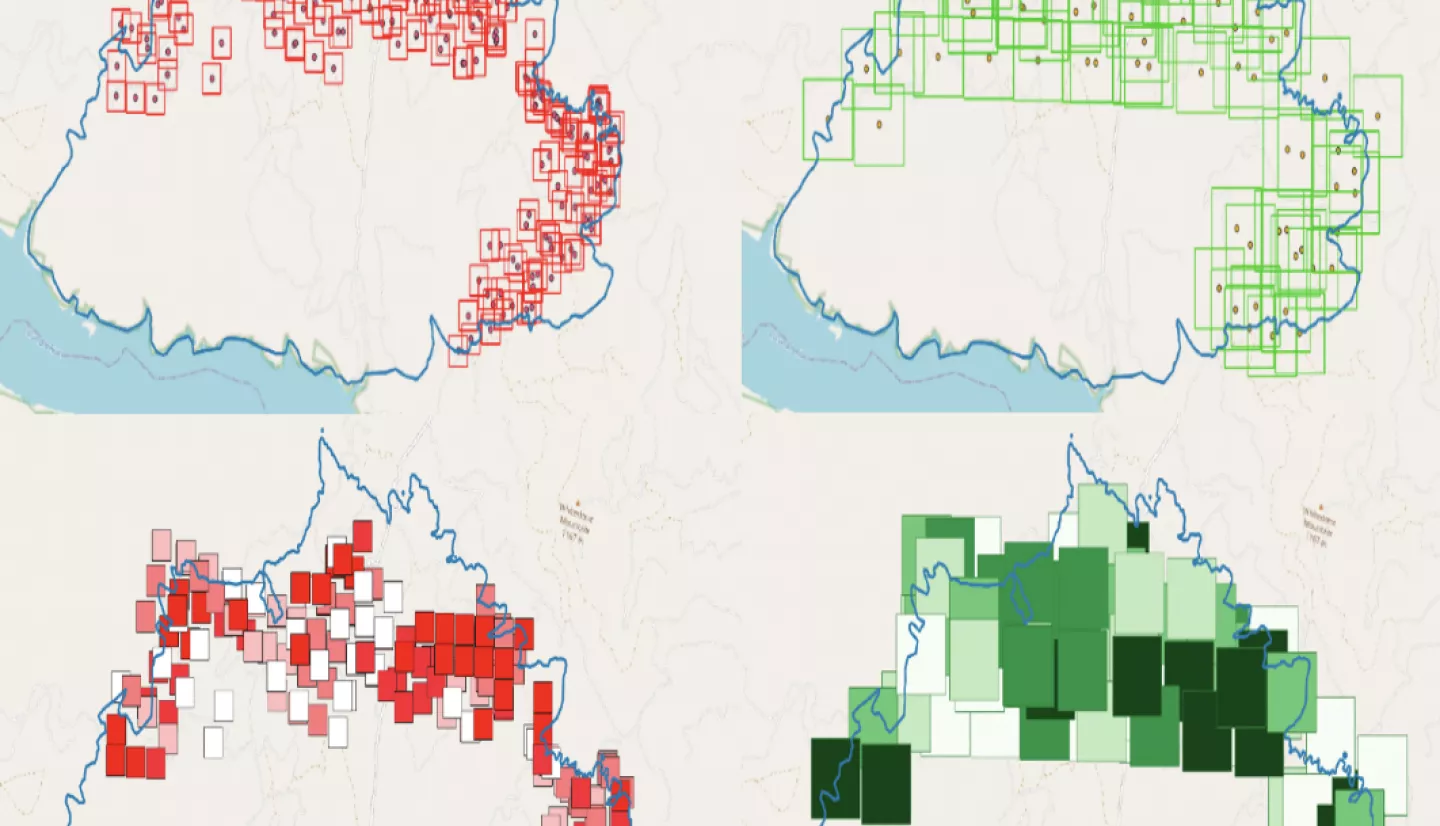
Wildland firefighters and decision-makers require information on potential wildfire growth. For this, interpreters will typically create two, easy-to-read, categories which group heat detections from airborne sensors: “intense heat” and “scattered heat.”
“Intense heat” is typically associated with flaming fronts, meaning areas of the highest fire intensity and activity. “Scattered heat” is typically used for areas with dispersed pockets of fire and regions with mixed fuel types.
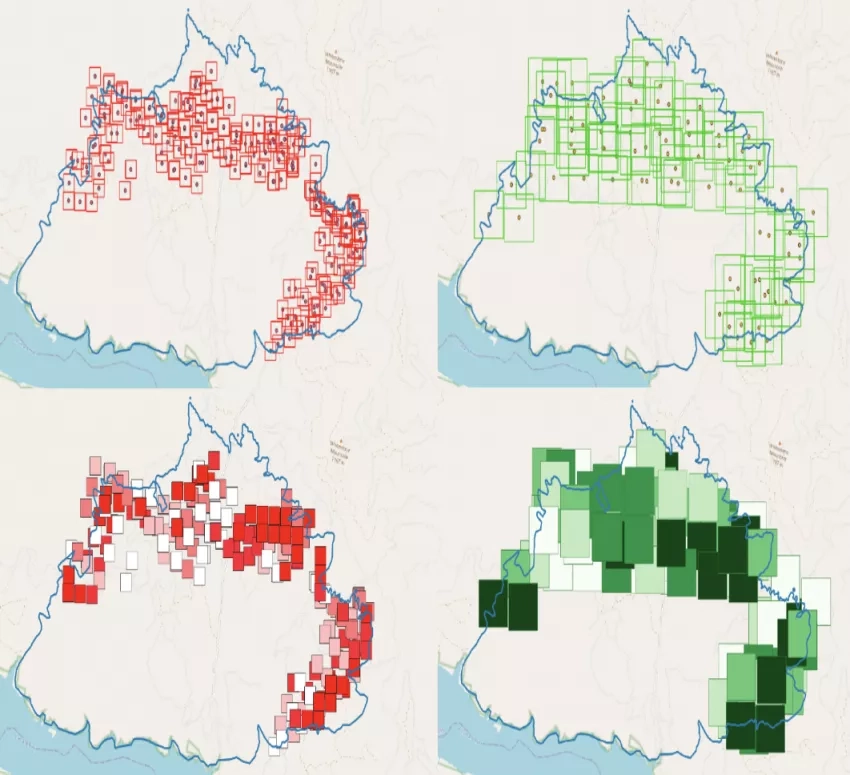
“Scattered heat” means the fire is expected to burn with less intensity than “intense heat” regions. Although there is no universal numeric threshold to define these categories, human infrared interpreters will typically assign areas with the highest and most concentrated infrared detections (typically brightest in infrared imaging) to be “intense heat” regions. Subsequently, areas with lower and more spread-out readings are assigned to “scattered heat” regions, as can be seen in the figure below for the Dixie Fire in the summer of 2021.
Satellite imagery also serves a critical role in infrared imaging and detection. Some examples of instruments and missions include the Moderate Resolution Imaging Spectroradiometer (MODIS) aboard NASA’s Aqua and Terra satellites; the Geostationary Operational Environmental Satellites (GOES); and the Visible Infrared Imaging Radiometer Suite (VIIRS) aboard NASA and satellites operated by the National Oceanographic and Atmospheric Administration (NOAA).
VIIRS and MODIS data is publicly available for download from the NASA Fire Information for Resource Management System (FIRMS). The 375m VIIRS active fire product and 1 km MODIS active fire product are near-real-time wildfire detection tools for incident management. While the key difference between the products is the spatial resolution, i.e., the footprint of each pixel, both products complement each other in thermal detection, location of potential wildfires, fire type, and fire radiative power values.
Fire radiative power is an important data attribute from satellite fire products because it provides an estimate of wildfire heat intensity for a single active fire detection to a group of detections. Using this numerical data, a gradient of values is created to act as a visual indicator of fire intensity concentrations to firefighters and where to expect possible expansion.
The fact that both VIIRS and MODIS cover a fire at different times of the day is also a strength for wildland fire managers. For example, areas near the equator can receive up to 4 snapshots a day from MODIS alone, with this number increasing as you move towards the poles. Aerial operations typically fly once a day due to the cost and sensor constraints, therefore satellite active fire products are value-added supplemental information. Combining both aerial and satellite active fire products provides incident management and firefighters with abundant geographic data to use for strategic decision-making.
Looking to the future, the Terra satellite is set to end operations as early as 2023. Similarly, Aqua is set to end in August 2026. The upcoming conclusion of the Aqua and Terra MODIS operations proposes new questions as to the next important steps for NASA satellite active fire products and research.
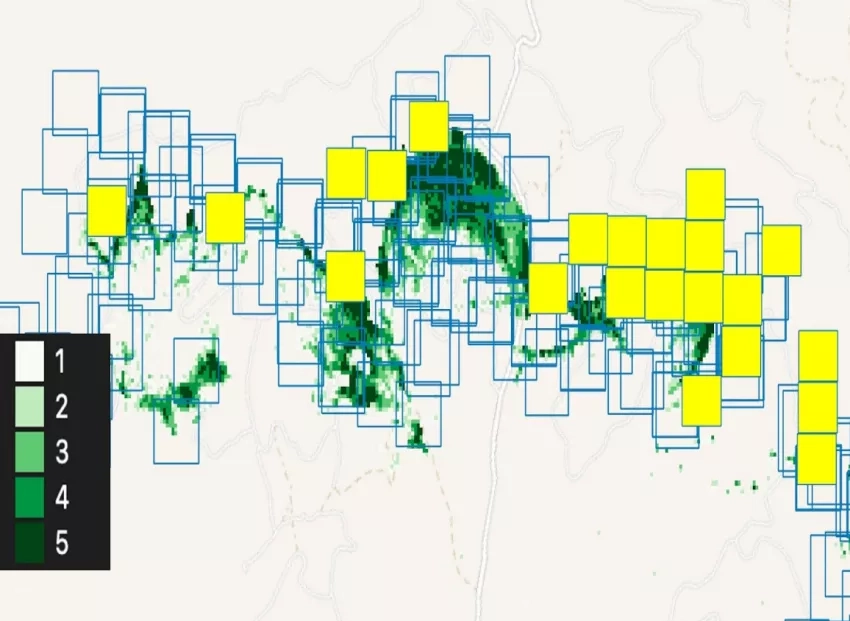
With the interest in and need for new infrared tools, NASA continues to conduct multiple research and design projects to improve active fire imaging capabilities. An example project is the research and development of a VIIRS fire radiative power categorization algorithm. Although this number is an already powerful visual indicator for wildfire decision-making, there is a need to tie satellite sensing data with aerial sensing data in order to effectively integrate the two different platforms in the same environment.
The algorithm project overlays VIIRS detections with heat-classified MASTER flyover data and attempts to match MASTER numeric readings with fire radiative power readings for every active fire detection. Early results demonstrate that VIIRS is potentially capable of replicating MASTER heat classifications. This means that VIIRS could be reliable enough to make “intense heat” and “scattered heat” classifications. The classifications would make VIIRS easier to interpret and use for wildfire decision-makers and firefighters.
Overall, NASA is involved in several aspects of active fire tracking and imaging through aerial and satellite platforms. Given that wildfire incidents continue to have a major presence across the western, central, and southern U.S., wildfire decision-makers and firefighters require not just more infrared imaging data, but easy-to-interpret and reliable fire mapping products. With strong visuals generated from data, incident management can make the best use of the information for quick and efficient decision-making. NASA fire products and science contribute to saving lives, property, and landscapes.