Farmers and decisionmakers now have a simple way to visualize and monitor crop health throughout the growing season, so they can better identify concerns before a food security crisis materializes. Called the Agrometeorological (AGMET) Earth Observation Indicators platform, it translates satellite data into easy-to-understand maps and graphs on local crop conditions. NASA Harvest and the Group on Earth Observations Global Agricultural Monitoring Initiative (GEOGLAM) created the AGMET platform, making these visualizations public.
“We hope to increase the awareness and use of Earth observation data in seasonal monitoring activities by both specialists and non-specialists alike to support early detection of drought, and enhance communities’ ability to make data-informed decisions in support of food security,” said Christina Justice, co-lead for NASA Harvest Food Security and Early Warning.
Quraishia Merzouk, a representative of the United Nations Food and Agriculture Organization (FAO) for Southern Africa and an FAO Early Warning Anticipatory Action Specialist, took part in a training on AGMET.
“[The training] provided us with technical insight on how Earth observation indicators can be used for agricultural monitoring, which indicators best serve as early warning through their ability to monitor crop health and environmental stressors, and exactly at which point we need to activate anticipatory action initiatives," Merzouk said.
Harvest, NASA’s contribution to the G20 GEOGLAM Initiative, worked with the GEOGLAM community to take the data processing burden off of crop analysts and provide a quick, effective, and easily digestible means of interpreting large amounts of global satellite data as the season progresses. These data include NASA’s Soil Moisture Active Passive (SMAP) mission and the Moderate Resolution Imaging Spectroradiometer (MODIS) onboard NASA’s Terra and Aqua satellites. NASA Harvest has been using data like soil moisture, temperature, and precipitation to help communities understand local crop conditions for years, but communities found this information so useful that they requested ways to access this data for themselves.
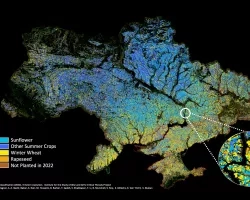
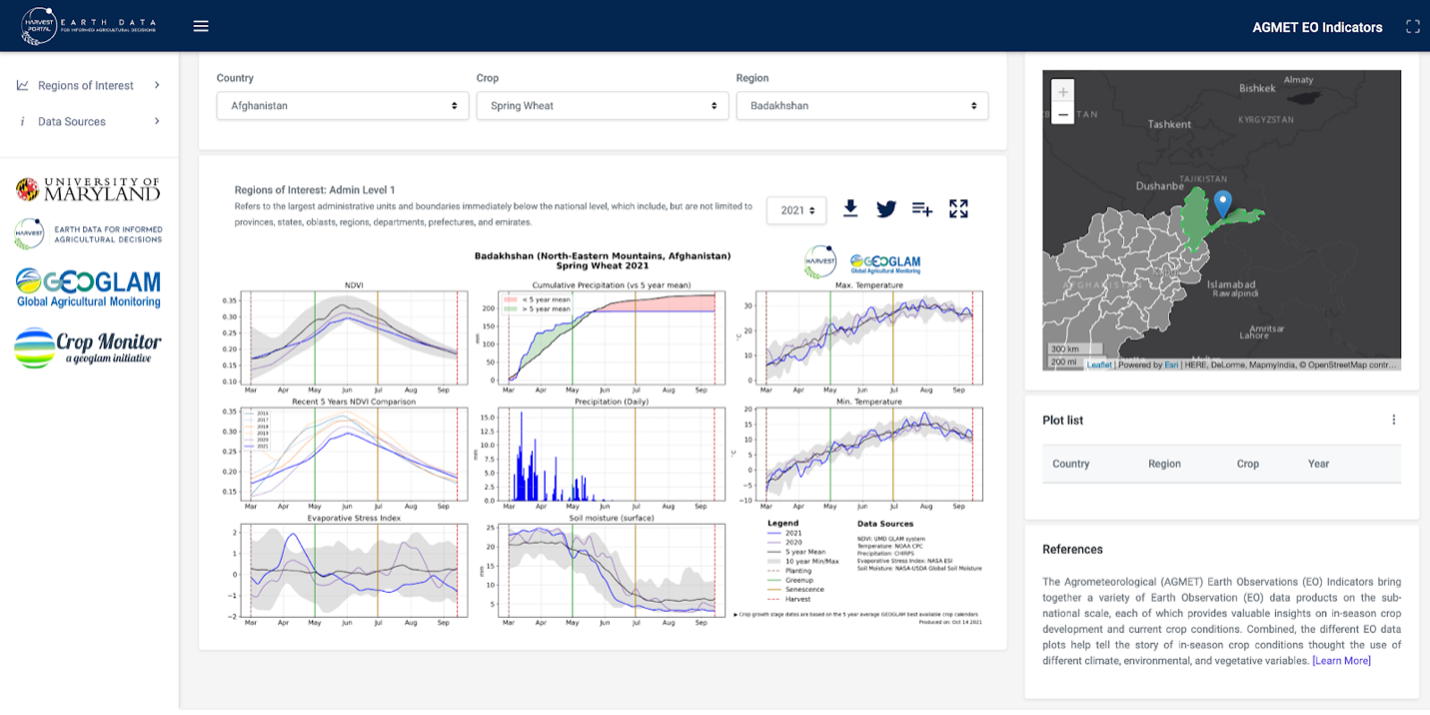
Ritvik Sahajpal, Harvest crop condition lead, was instrumental to the development of AGMET graphics, processing the data manually for years for use by decisionmakers. Thanks to Sahajpal and his team, these data are now fully automated and publicly available to help communities keep track of how well crop production is shaping up relative to previous years in a cost-effective and timely manner. The easy-to-use online format allows analysts to select their country, region, year, and crop of interest. This allows farmers, economists, policymakers, humanitarian agencies, and other agricultural players around the world to more effectively plan, supporting decisions to prevent communities from going hungry.
The AGMET Indicators are currently being processed for each country covered in the GEOGLAM Crop Monitors, which together comprise over 90% of the world’s croplands, with the goal of expanding the tool to include additional countries moving forward.
More information about NASA’s work with Earth observations for agriculture can be found on the Agriculture program area homepage.