Displaying 21 - 26 of 26
![Aerosol Optical Depth for a dust event on July 26th-27th, 2021, calculated with the MAIAC algorithm from Terra and Aqua MODIS satellite data. Great Salt Lake surface area, in blue, was derived from JRC Yearly Water Classification History and processed imagery from Landsat 5, 7, and 8. The map depicts regions that are most impacted by dust surrounding the Great Salt Lake. Red and Yellow represent high dust levels within Northern Utah.](/sites/default/files/styles/lis/public/2023-05/2023Spring_VEJ_GreatSaltLakeHAQ_WebImage.jpg.webp?itok=T6r5Pogy)
Topic
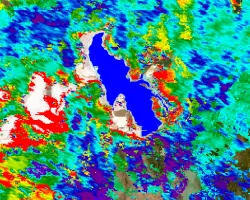
Great Salt Lake Health and Air Quality (2023 Spring) Team: Piper Christian (Project Lead), Fiona Summers, Yoana Vargas Magana, Andrea Delgado Summary: Water flow into...
![Aerosol optical depth concentration from MODIS, captured on August 16, 2020, during the fire season. Dark purples hues indicate normal atmospheric conditions, while orange and yellow hues show high concentrations of aerosols, suggesting the presence of smoke and particulate matter following a fire event. MODIS aerosol optical depth can be used as a proxy for PM2.5 pollution, increasing decision makers’ capacities to monitor and address the negative effects of wildfire smoke plumes on residential areas.](/sites/default/files/styles/lis/public/2023-05/2023Spring_LaRC_ColoradoSpringsHAQ_WebImage.png.webp?itok=rNvnSpEC)
Topic
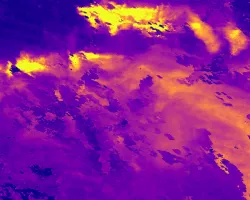
Colorado Springs Health and Air Quality (2023 Spring) Team: Olivia Etherton, Jeanette Moritz, Joshua Stokes, Ephrata Yohannes Summary: The City of Colorado Springs, situated in...
DEVELOP
Wildland Fires
Climate
Capacity Building
Ecological Conservation
Health & Air Quality
Water Resources
![Average aerosol optical depth (AOD) for the months of May and June in 2015 in Oregon and Washington, derived from MODIS data. Orange represents higher aerosol concentrations whereas purple represents areas with lower aerosol concentrations. The AOD averages show higher observed AOD along the coasts of Oregon and Washington.](/sites/default/files/styles/lis/public/2024-01/2023Sum_NC_PacificNorthWestHAQ_WebsiteImage.jpg.webp?itok=CKJ1vDx_)
Topic
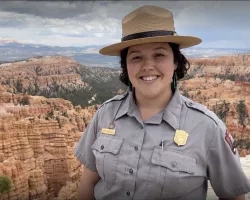
Pacific Northwest Health & Air Quality (Summer 2023) Team: Abby Sgan (Project Lead), Greta Bolinger, Tallis Monteiro, Cristina Villalobos-Heredia, Taylor West Summary: Recent studies have...
![2022 imagery of 95th percentile Aerosol Optical Depth (AOD) data from Terra/Aqua MODIS mapped against social vulnerability data from the EPA's EJScreen within the San Joaquin Valley's census tracts. Pink indicates higher levels of at-risk populations, and blue indicates higher levels of AOD. Darker shades of blue and purple indicate an overlap of high levels of air pollution and high at-risk population.](/sites/default/files/styles/lis/public/2024-01/2023Sum_VEJ_SanJoaquinValleyHAQ_WebsiteImage.png.webp?itok=RWE-BbSo)
Topic
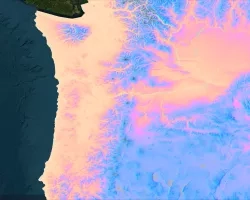
San Joaquin Valley Health & Air Quality (Summer 2023) Team: Jonathan Szeto (Project Lead), Jasper Beardslee, Piper Christian, Bethany MacCarter, Alma Quintero Summary: Little Manila...
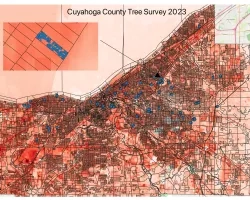
![Land surface temperatures for study area (Cuyahoga County, Ohio), as derived from Landsat. Black lines show boundaries of census blocks. Blue dots show the greenspaces and census blocks where the on the ground tree surveys have been conducted, with one census block highlighted as an inset. Image Credit: Rob Moore (Cleveland State).](/sites/default/files/styles/lis/public/2024-05/Mueller%20Project%20Page%20Image_0.png.webp?itok=nYl76fWk)
Topic
Team: Kevin Mueller (Cleveland State University), Brice Grunert (Cleveland State University), Thomas Hilde (Cleveland State University), Kaiguang Zhao (Ohio State University), Daniel Meaney (Cuyahoga County...