Displaying 231 - 240 of 290
HAQ Newsletter - October-December 2021
Topic
Resource Type
![This image depicts chlorophyll-a concentrations along the Southern California Coast during a Harmful Algae Bloom, also known as a Red Tide Event. The ocean imagery was taken in April of 2020 by Aqua MODIS and used to generate chlorophyll-a concentration. The land imagery was taken by Sentinel-2 MSI during the same time period, and a Normalized Difference Chlorophyll Index was applied to it for visualization purposes. Blue and green indicates high and low chlorophyll-a concentrations, respectively. On land,](/sites/default/files/styles/lis/public/2022-05/2021Fall_ARC_SoCalHAQ_WebImage.png.webp?itok=1m8SL35K)
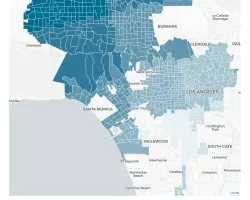
Southern California Health & Air Quality (Fall 2021) Team: Michael Enz (Project Lead), Melanie Leung, Maya Zimmerman, Jonathan Van Dermark, and Petra Nichols Summary: In...
![The difference in Aerosol Optical Depth (AOD) between ozone spike days in summer 2018 and 2020 in Seiling, Oklahoma. AOD measures particles distributed within a column of air and can help predict tropospheric ozone spikes and inform regulatory organizations. Data derived from Terra and Aqua MODIS with 2020 Landsat 8 imagery as a base map. Yellow represents the greatest difference in AOD and purple represents the least difference, with green in the middle. Areas with negative values were removed.](/sites/default/files/styles/lis/public/2022-03/2021Fall_JPL_OklahomaHealthAndAirQuality_WebsiteImage.jpg.webp?itok=PR2zL79Y)
Oklahoma Heath & Air Quality (Fall 2021) Team: Carolina Rosales (Project Lead), Robert Alward, Kjirsten Coleman, Katherine Howell, and Vanessa Machuca Summary: Tropospheric ozone (O3)...
![Oversampled nitrogen dioxide (NO2) atmospheric column data from select months (May – September) in 2019 derived from the OMI sensor aboard the NASA Aura satellite. The darker purple colors reflect lower concentrations of NO2 in our study region, but as the color scale moves towards brighter yellow it represents high concentrations of NO2. Assessing the NO2 gas distribution, in addition to other gases, can aid project partners in identifying hotspots of emissions.](/sites/default/files/styles/lis/public/2022-03/2021Fall_LaRC_SoutheastMichiganNorthernOhioHealthandAirQuality_WebsiteImage.png.webp?itok=-X50Y6mw)
Southeast Michigan Health & Air Quality (Fall 2021) Team: Mariam Moeen (Project Lead), Helen Turvene, Yuan Lin, and Albert Kodua Summary: Pollutants resulting from industrial...
Applied Sciences
Capacity Building
Disasters
Ecological Conservation
Agriculture
Health & Air Quality
Water Resources
Health & Air Quality Annual Reports
Topic
Resource Type
Applied Sciences
DEVELOP
VALUABLES
Capacity Building
Disasters
Health & Air Quality
Water Resources
HAQ Newsletter - January-March 2022
Topic
Resource Type