Start Date: March 19, 2022
Type: Volcanoes, Earthquakes
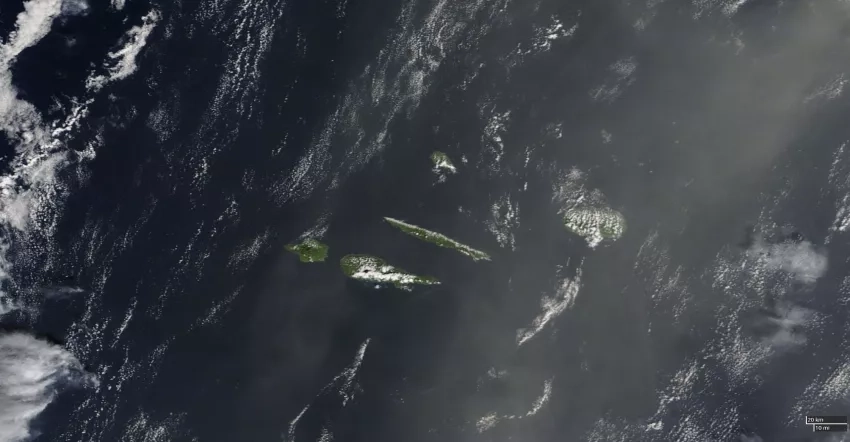
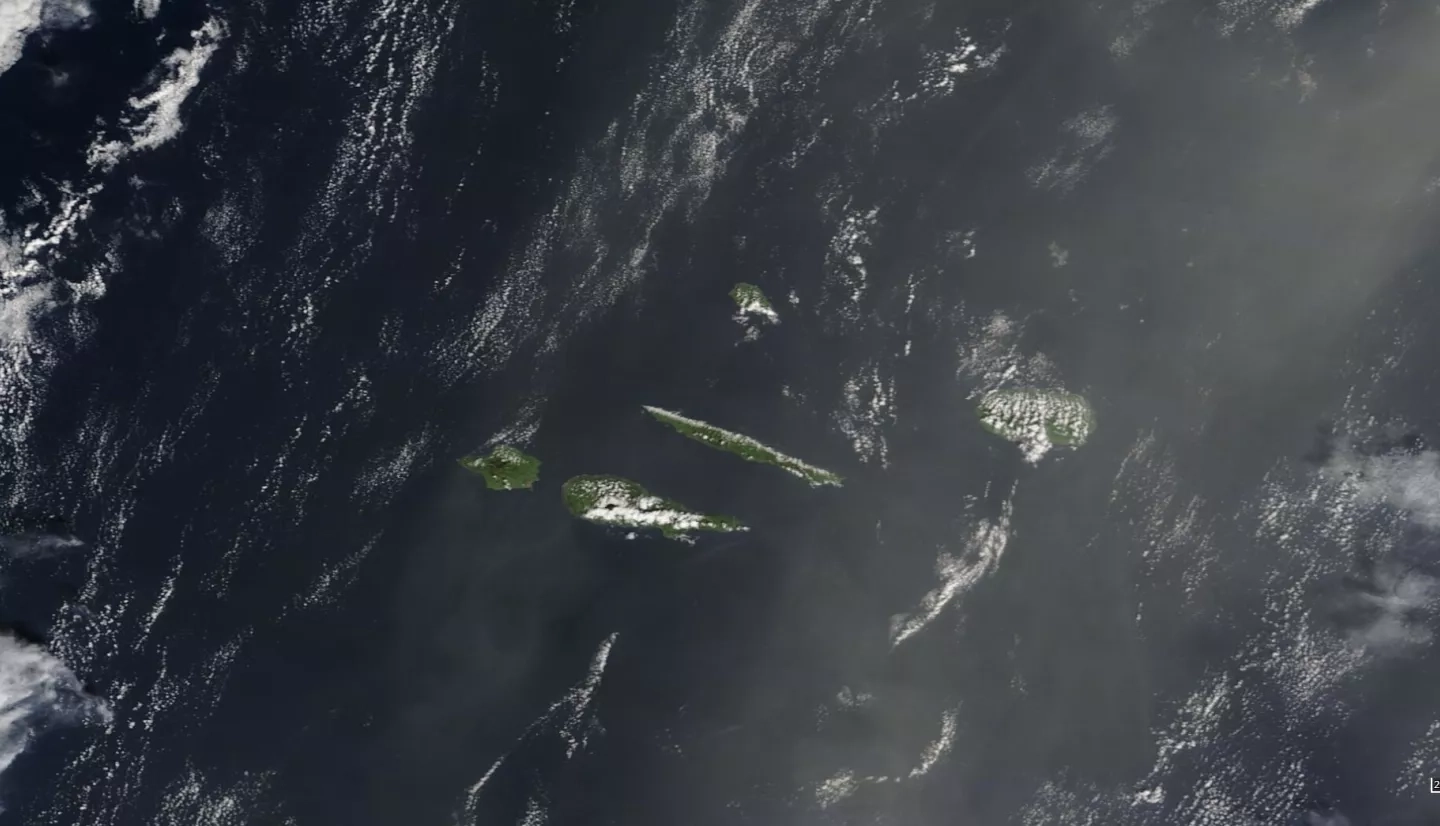
Region: Europe - São Jorge, Portugal
Info & Resources:
São Jorge island, located in Portugal's Azores archipelago, has experienced a continuous series of tremors since mid-March. While the earthquakes have remained at lower magnitudes, with the highest magnitude quake reaching a 3.8 on the Richter scale, there are concerns that continued seismic activity could result in a volcanic eruption or stronger earthquakes. If a volcanic eruption were to occur, it would be the first eruption on the island in over 200 years.
The NASA Earth Applied Sciences Disasters program area has activated efforts, along with NASA’s Advanced Rapid Imaging and Analysis (ARIA) team, to collaborate with the Azores Seismovolcanic Surveillance and Information Center (CIVISA) and the Azores Regional Civil Protection and Fire Service (SRPCBA) to provide Earth-observing data and mapping to assist in reducing risk of a potential eruption.
ARIA produced interferograms using Sentinel-1 SAR datasets from Nov. 4, 2014 to April 2, 2022. These interferograms were sent to Azores authorities to map deformation or movement of São Jorge’s surface.
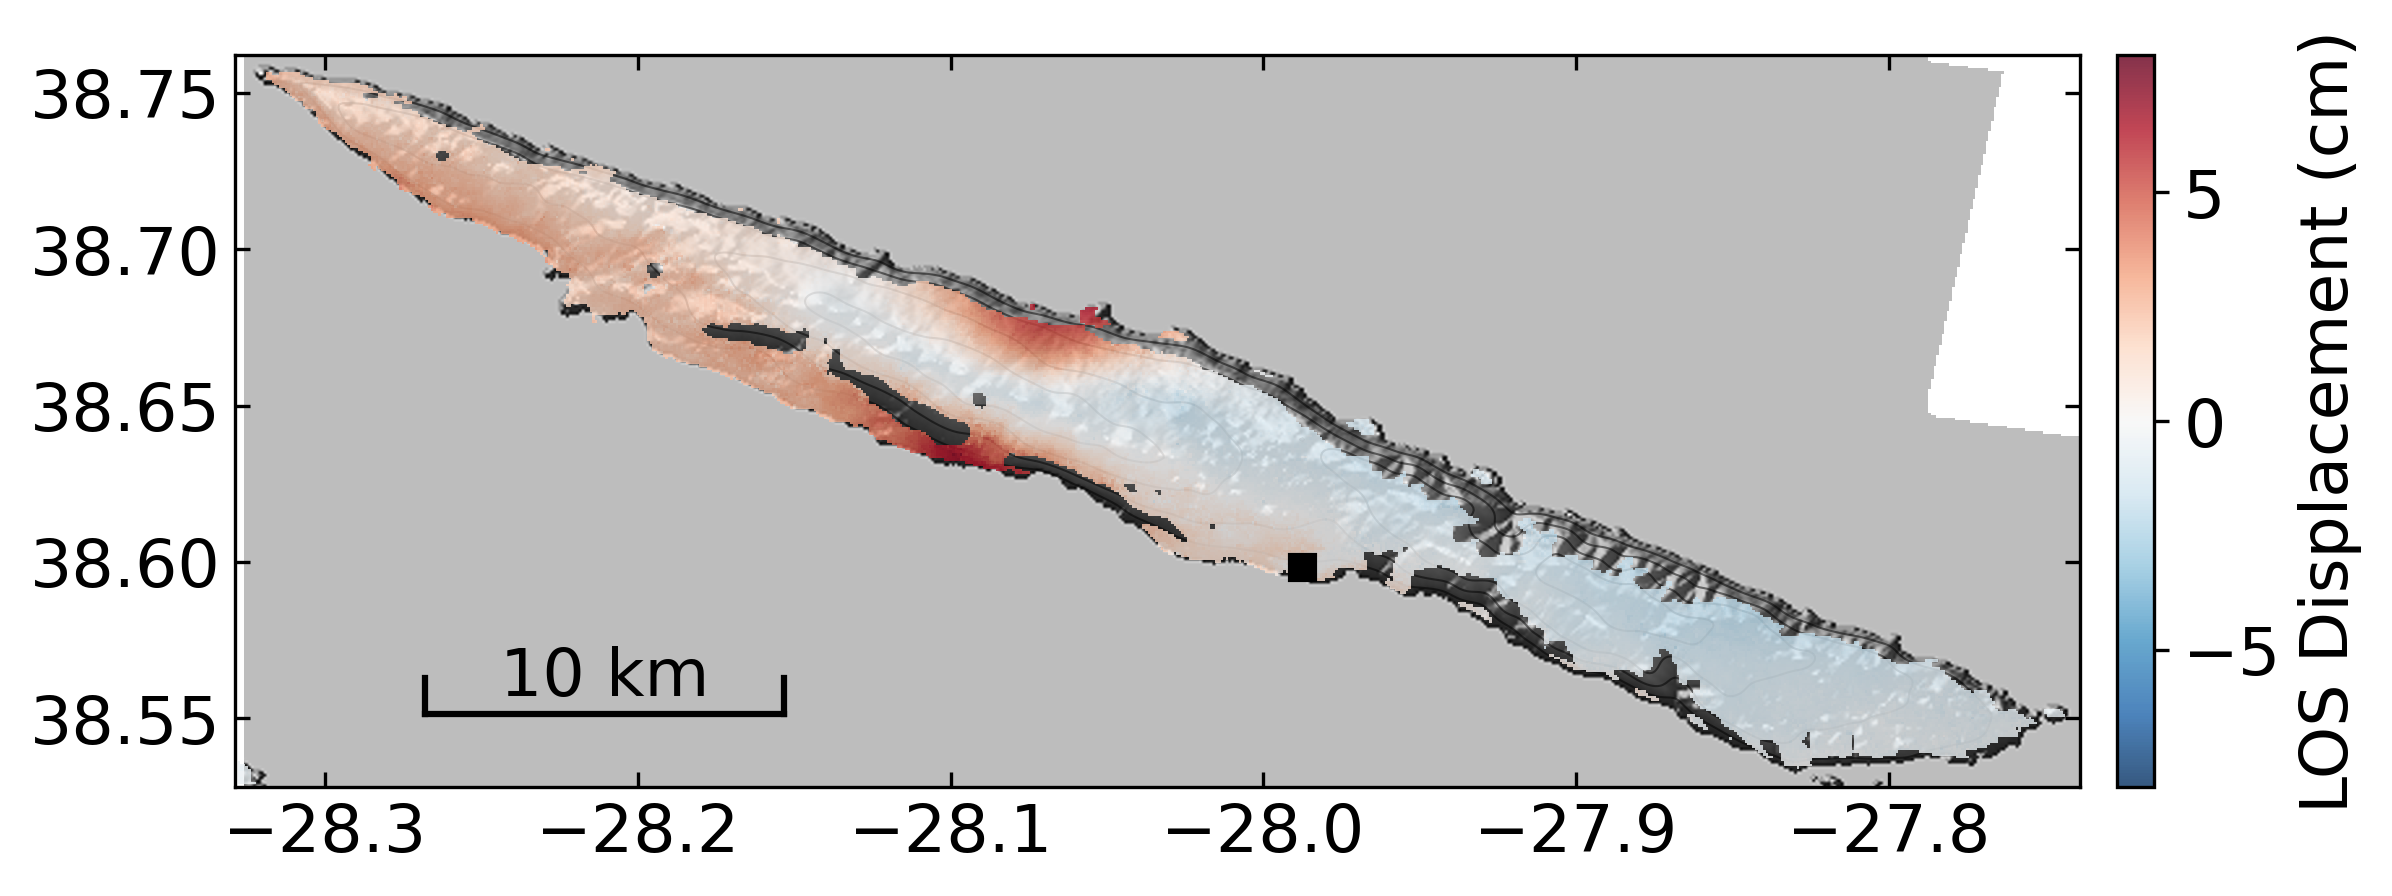
Deformation maps created from Sentinel-1 descending and ascending datasets indicate that the island experienced significant deformation between late Feb. and late March. More recent deformation maps, from late March to early April, show slight to no deformation – indicating that the unrest peaked in March and may be waning.