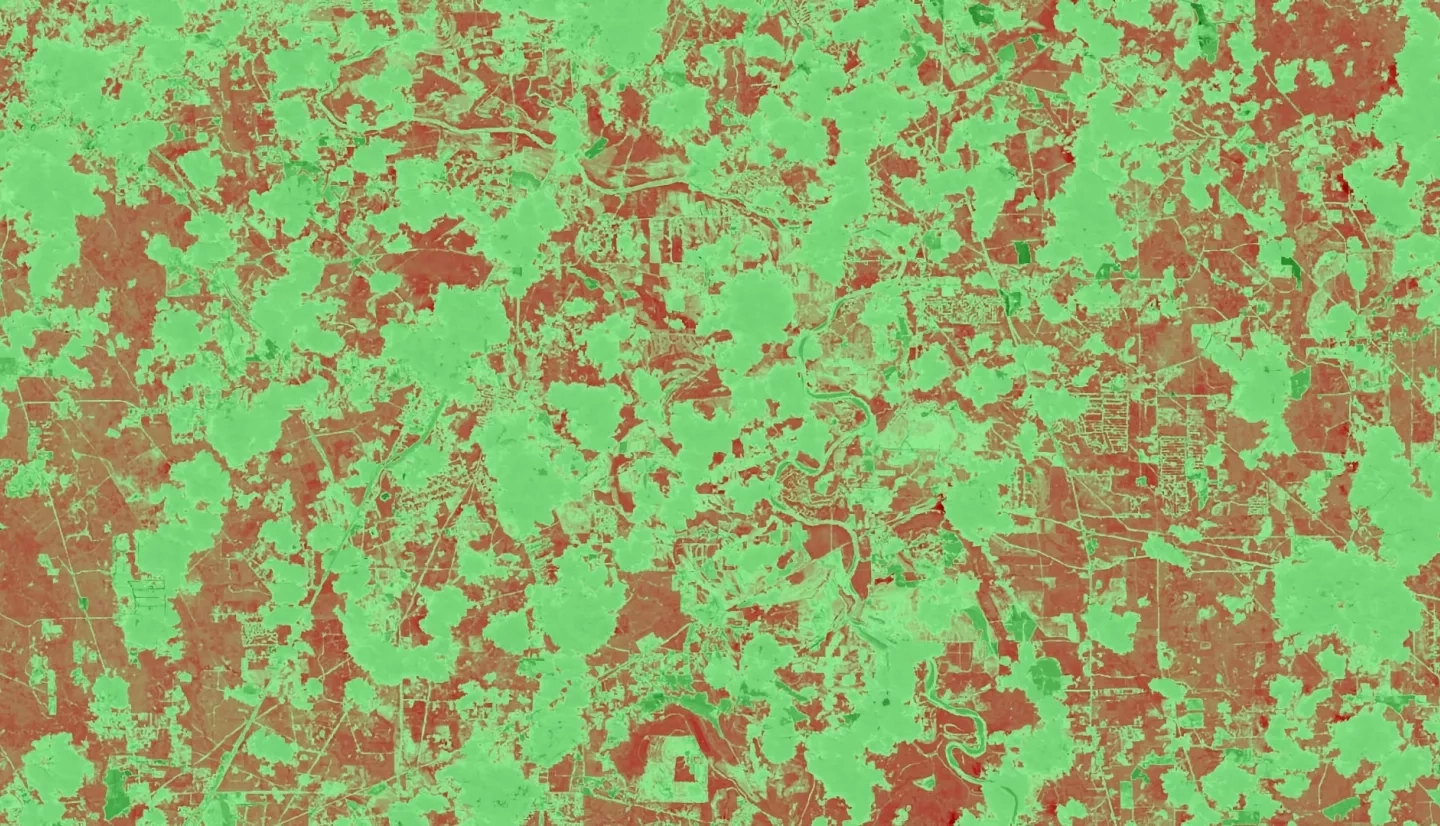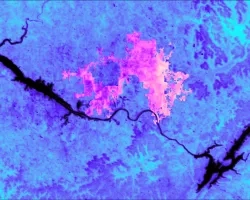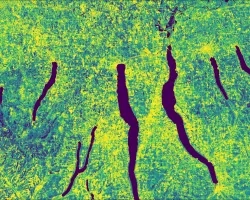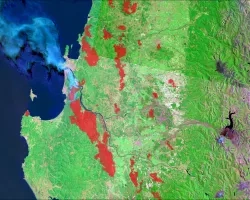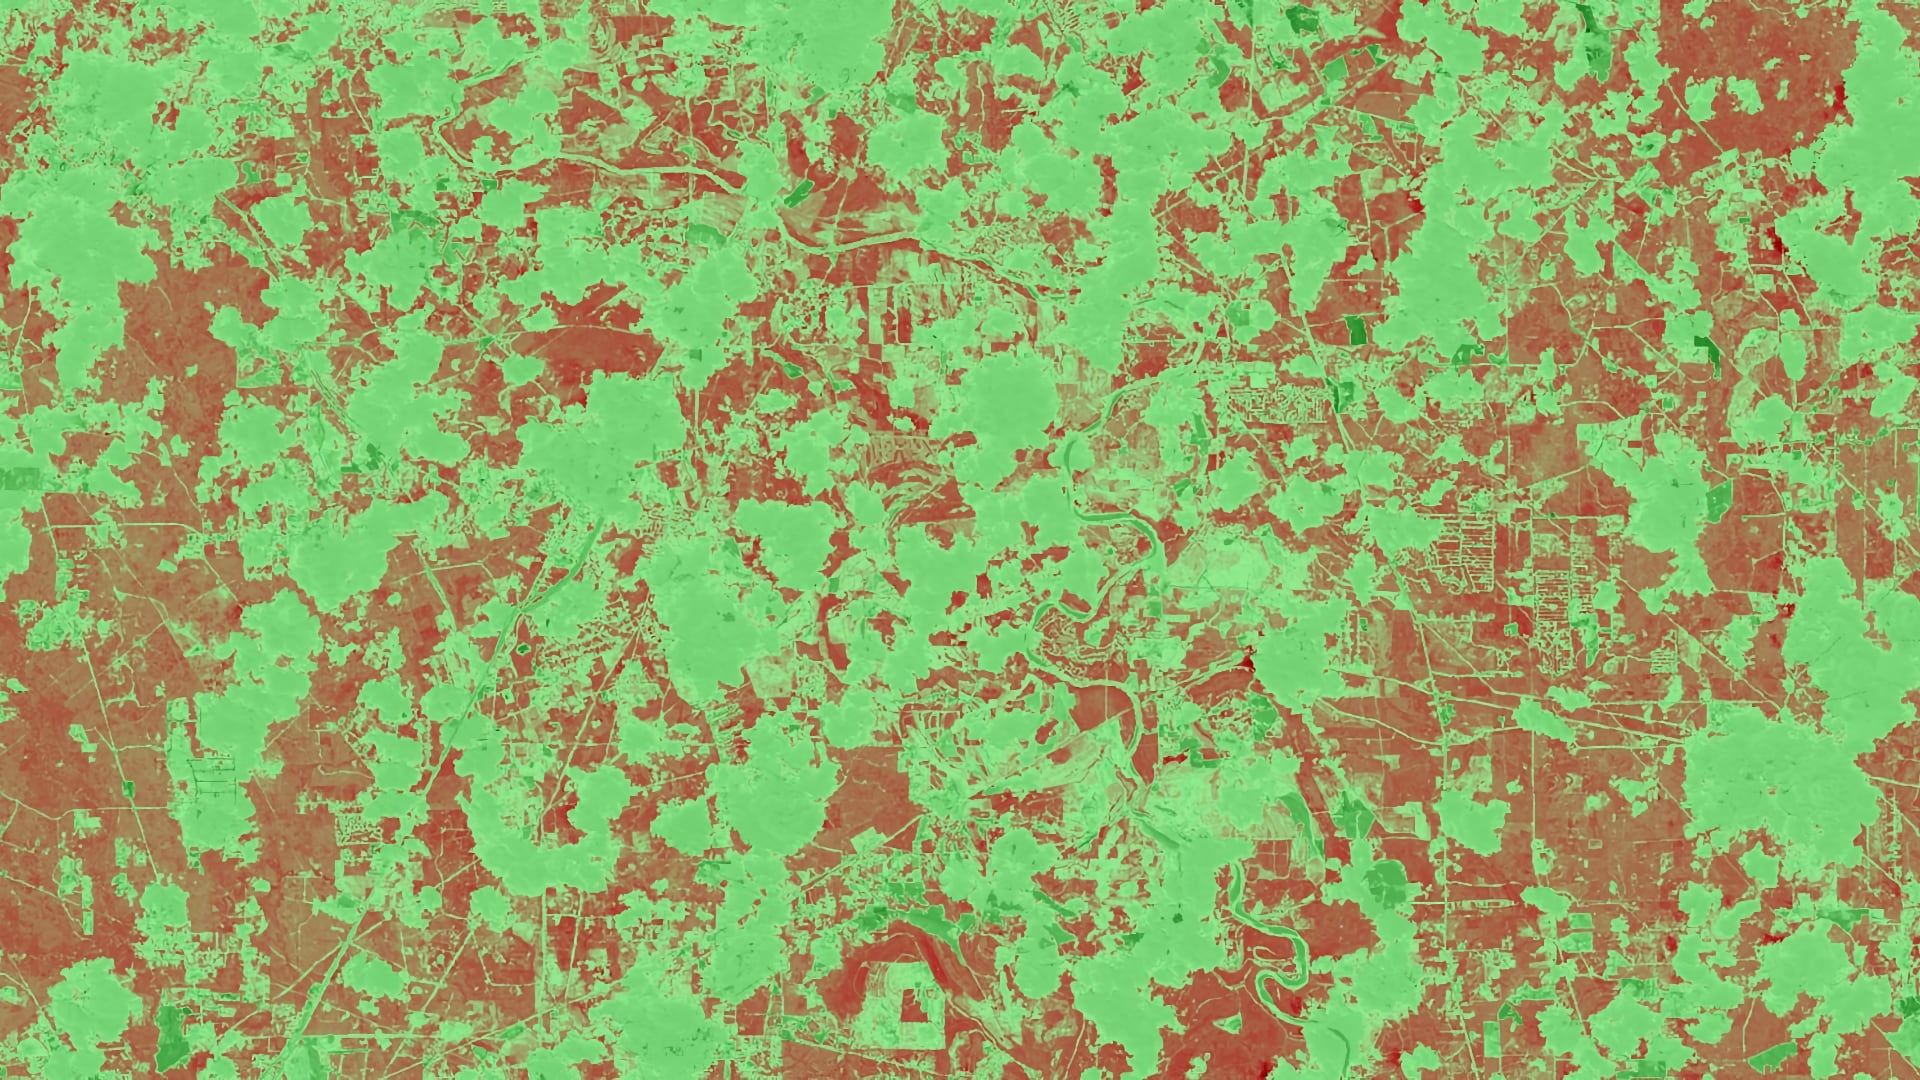
In 2011, Texas experienced a severe drought that caused substantial economic and environmental losses. The Texas A&M Forest Service (TFS) estimated that 300 million trees succumbed to the severe drought conditions, with urban areas, in particular, losing about 5.6 million shade trees. For these estimations, the TFS uses resource-intensive in situ data collection methods. Studies have shown that ground-based inventories of the Urban Tree Canopy (UTC) can be augmented with remote sensing data. To explore this, the TFS Sustainable Forestry Department and the US Forest Service Southern Research Station partnered with NASA DEVELOP. For this project, our team aimed to assess pre- and post-drought canopy mortality in Austin and Houston. We implemented an unsupervised classification technique on National Agriculture Imagery Program (NAIP) high-resolution aerial imagery to determine the existence of UTC. Then, using the Normalized Difference Vegetation Index (NDVI) derived from Landsat 5 Thematic Mapper (TM), Landsat 7 Enhanced Thematic Mapper Plus (ETM+), and Landsat 8 Operational Land Imager (OLI) data, we analyzed the relationship between NDVI anomalies and canopy mortality. Additionally, we utilized the Standardized Precipitation-Evapotranspiration Index (SPEI) derived from the National Oceanic and Atmospheric Administration’s nClimGrid dataset to give a broader context of climatic variables surrounding canopy loss. Ultimately, our results will be used by the TFS to identify areas that are likely to experience higher instances of UTC mortality and to monitor trends in recovery.
