Imagen
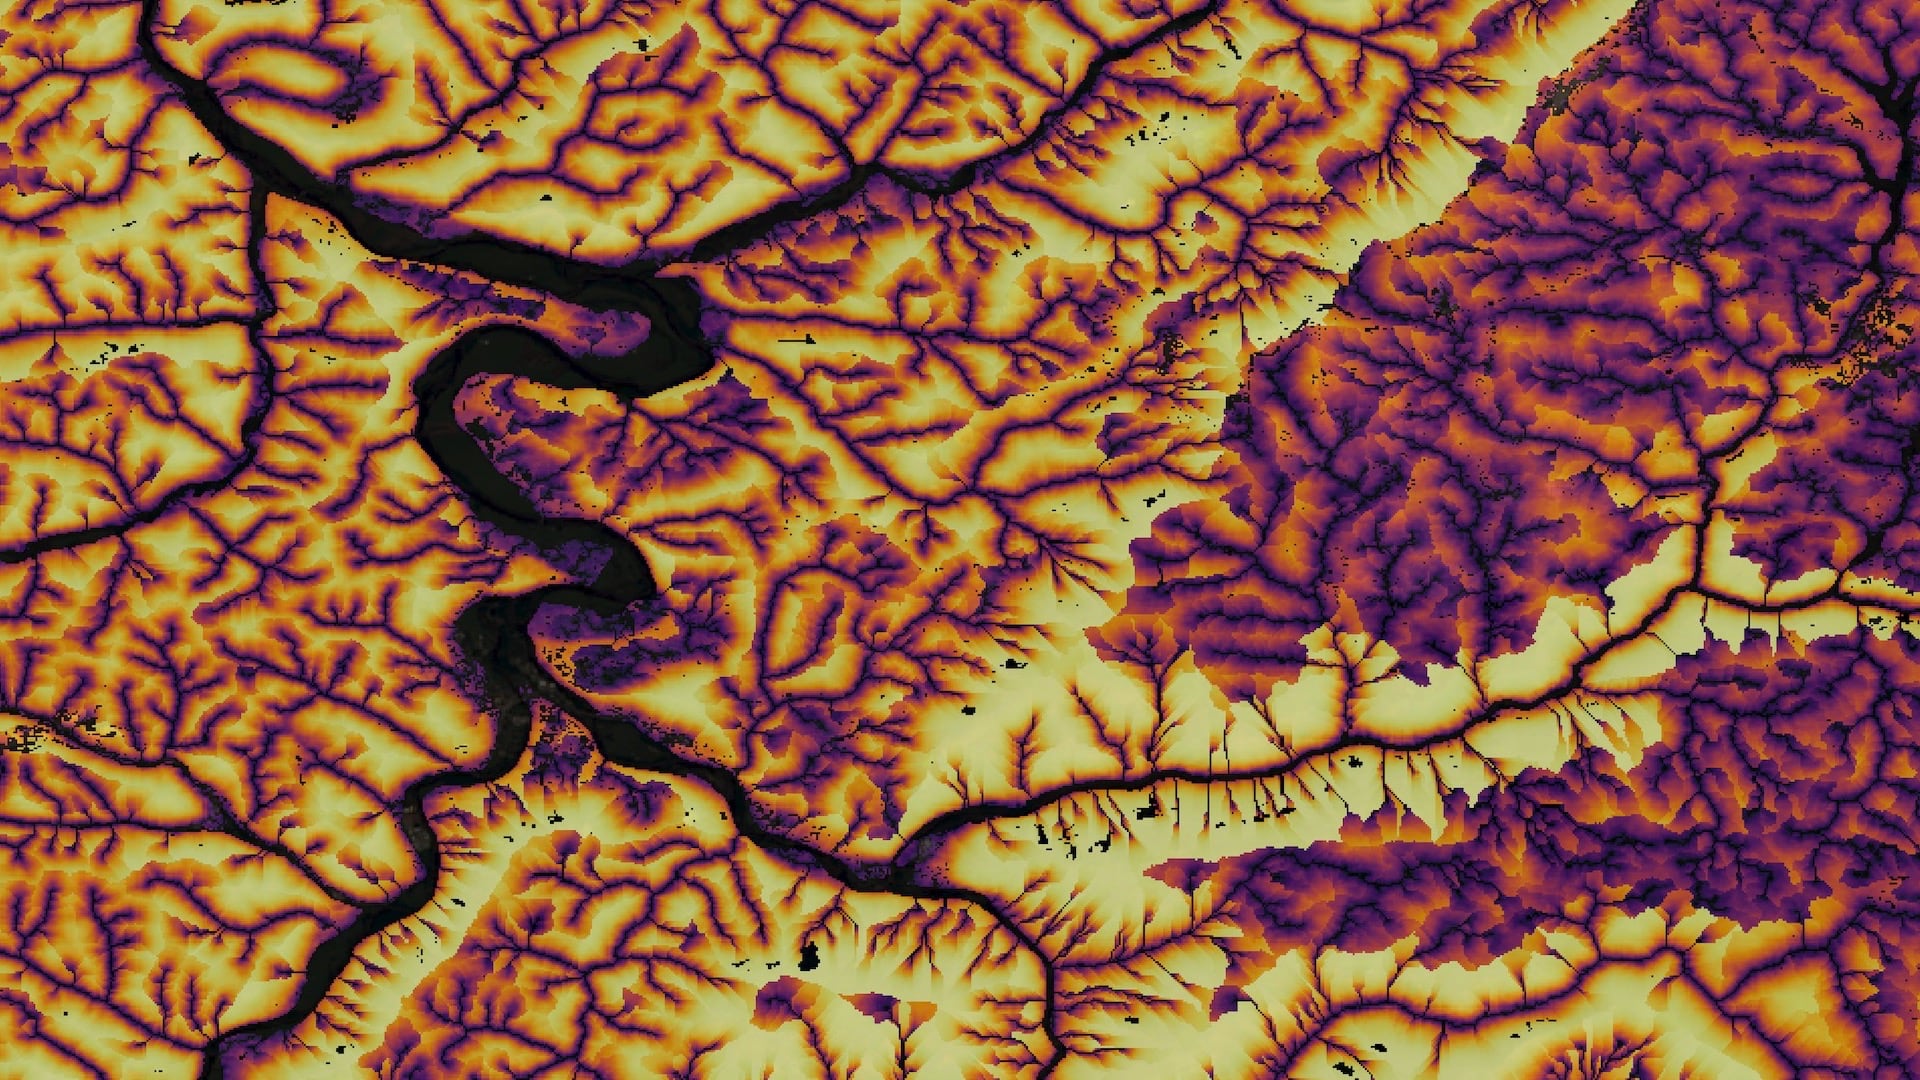

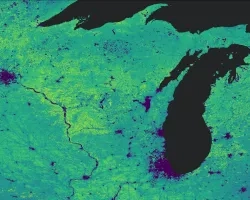
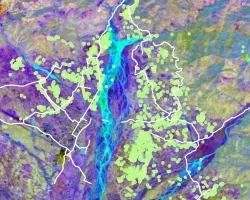
The Cheat River, primarily located in northeast West Virginia, experiences major flooding events that negatively impact nearby communities. Poor water quality due to acid mine drainage and excess sediment loads during flood events threaten the health of communities and numerous animal species who depend on the Cheat as a primary water source. Communities in the Cheat River watershed are confronted with floods that can destroy housing, key infrastructure, and crops, and also further pollute the river. A warming climate is predicted to increase precipitation and storm severity in the region, which could increase flood frequency in the watershed. The team partnered with the Friends of the Cheat (FOC), an organization that has historically focused on mitigating acid mine drainage in the river and has recently begun to focus on proactive flood mitigation. Utilizing Landsat 5 Thematic Mapper (TM), Landsat 8 Operational Land Imager (OLI), and Shuttle Radar Topography Mission (SRTM) data, the team conducted a climatology time series analysis, monitored changes in land use and land cover change, and created flood risk and vulnerability maps to improve FOC’s flood mitigation efforts. To calculate the change in precipitation and temperature, the team used the equations of the linear trend lines based on annual averages of Preston and Tucker counties and averaged the results. These results indicated that temperature has increased by about 1.5°C and precipitation has increased by 4.2 inches between 1970 and 2020, while monthly river discharge has become more variable. At the same time, there were no detectable trends in land cover at the county level. Communities near Parsons, Masontown, Reedsville, and Eglon are among the most vulnerable to flood events based on the flood vulnerability analysis.