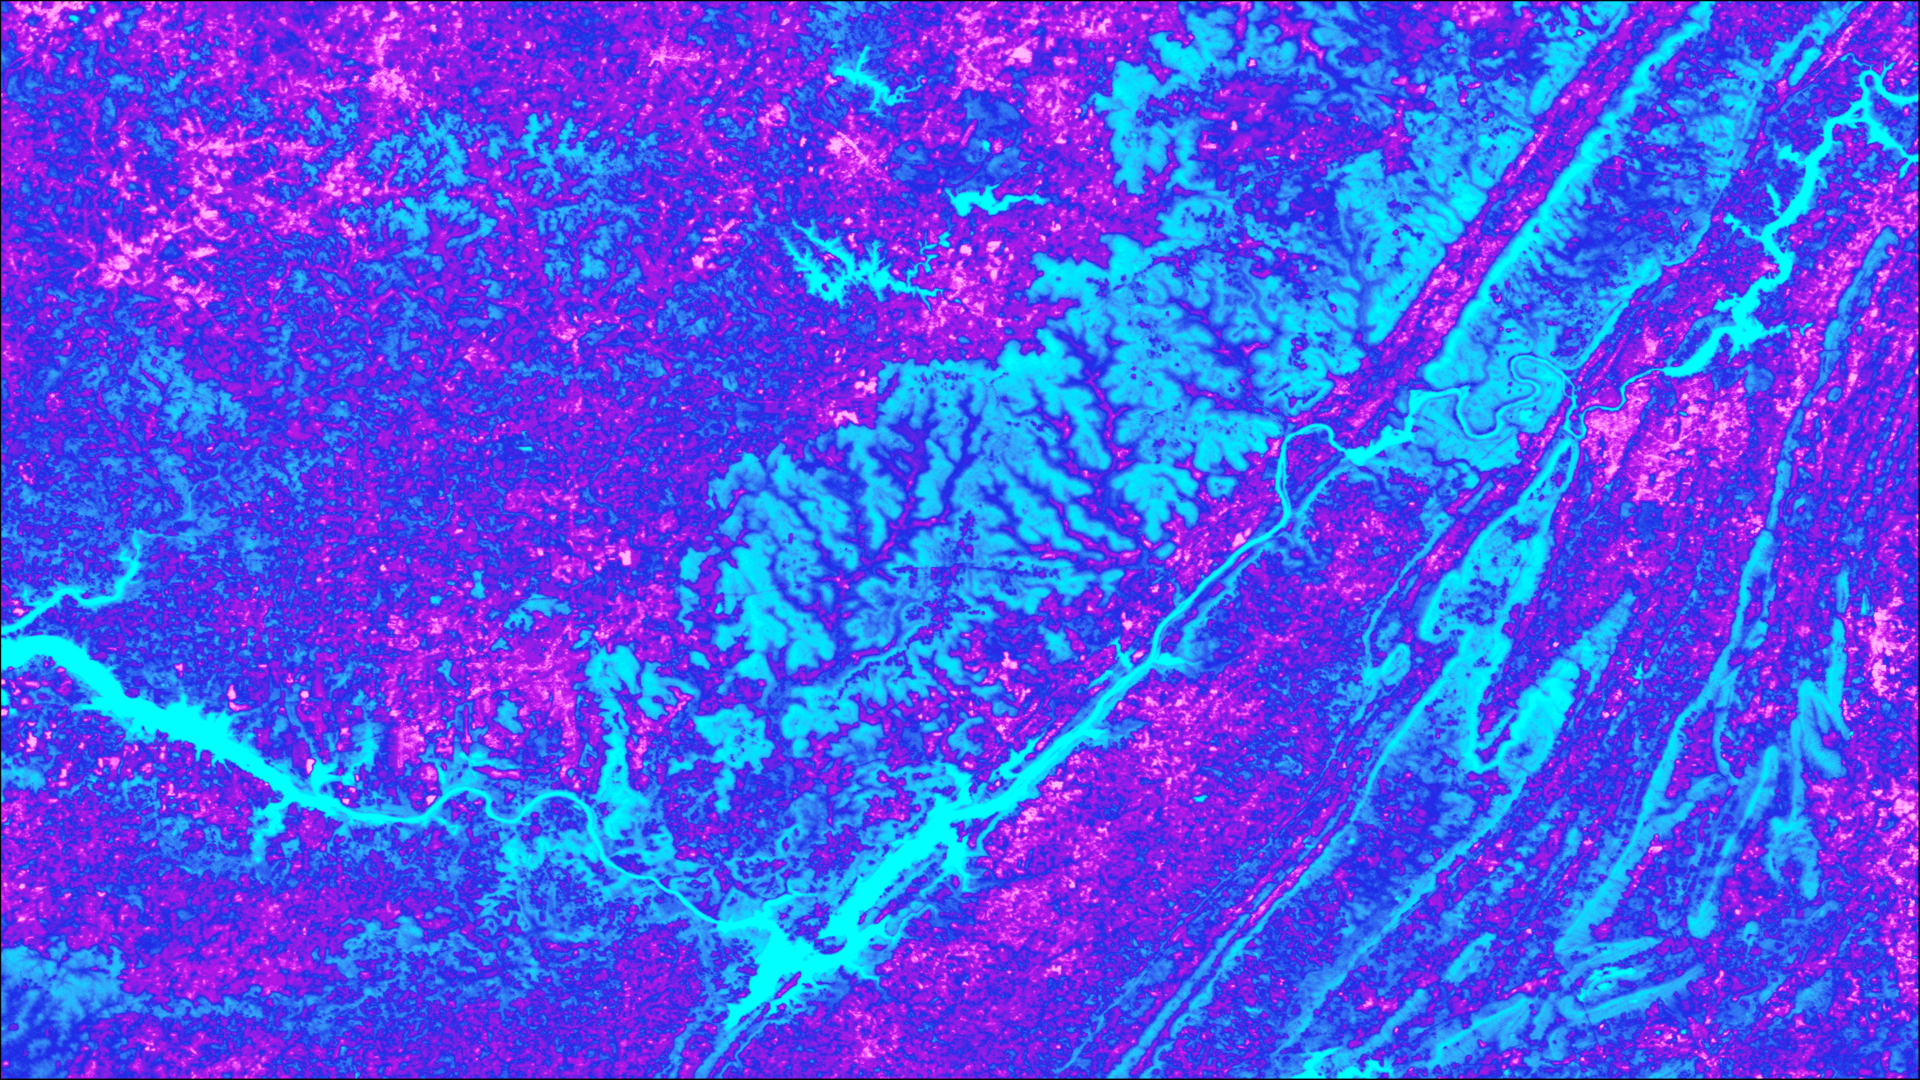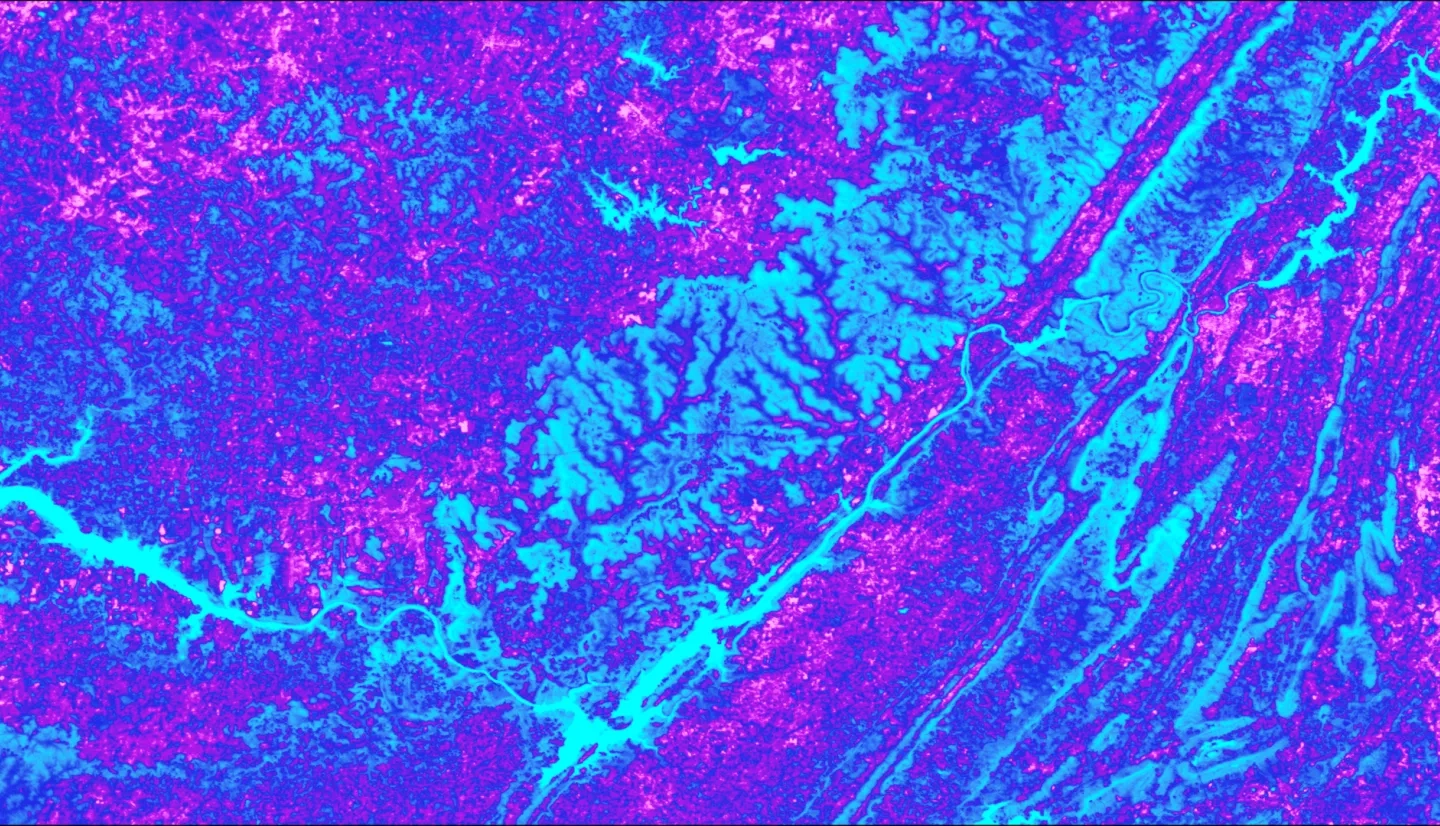
Aquatic ecosystems are susceptible to biodiversity loss due to increased water temperatures, which can select for heat-tolerant species and lead to a loss of locally adapted species that have a narrow temperature range. Regulations concerning heated effluent from nuclear power plants are administered by the Environmental Protection Agency (EPA) in order to avoid damage to surrounding ecosystems. This project utilized thermal infrared data from NASA’s Advanced Spaceborne Thermal Emission and Reflection Radiometer (ASTER), Ecosystem Spaceborne Thermal Radiometer Experiment on Space Station (ECOSTRESS), and Landsat 8 Thermal Infrared Sensor (TIRS) along the Tennessee River to help improve river temperature predictive models used by the Tennessee Valley Authority’s Browns Ferry Nuclear Plant (BFNP). To do this, the team highlighted spatial and temporal variation in river surface temperature as a result of seasonal change, flow rate, ambient air temperature, and plant power output. Results from the BFNP study area indicated that from 2013 to 2018, the change in water temperature between upstream and downstream locations (ΔT) increased by 3.546°F (p)


