Imagen
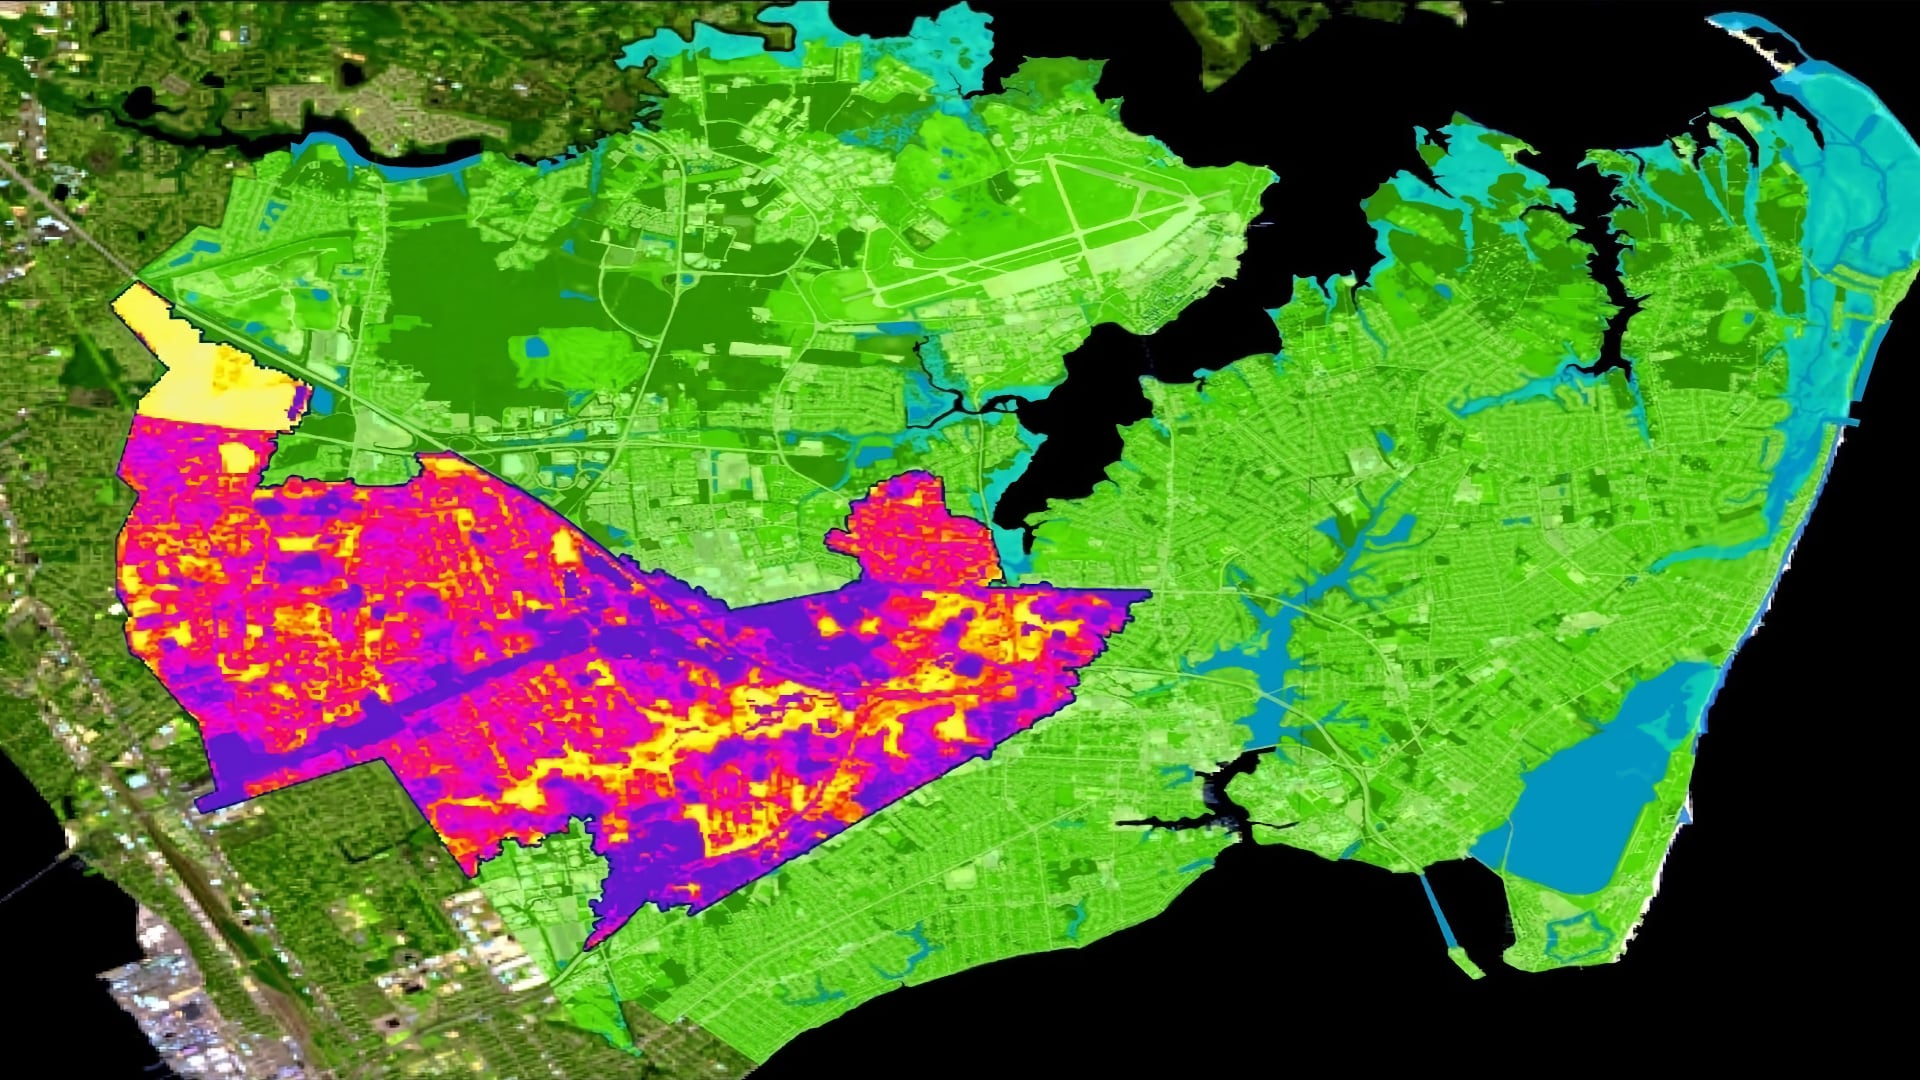
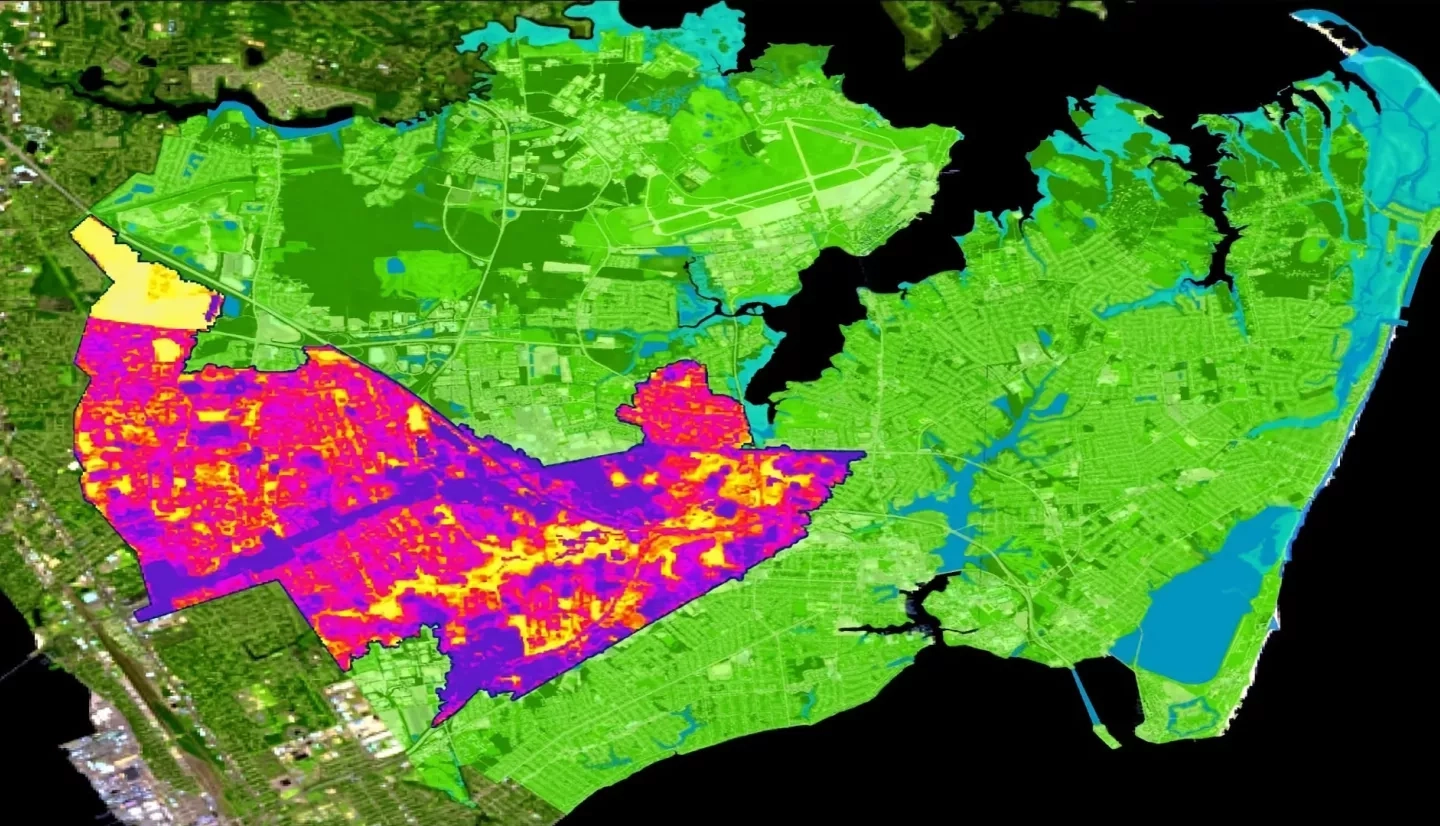
Hampton Roads’ 1.6 million residents thrive on bustling military, harbor, and environmental industries. The region’s stakeholders identified an increasing flood and water quality risk due to urbanization, a changing climate, and sea-level rise. These hazards threaten not only the livelihood of Hampton Roads residents but also the well-being of the entire country as several key federal facilities exist in the region. Impervious surface cover and urban tree canopy cover are two known variables that influence flood risk. Using Landsat 5 Thematic Mapper and Landsat 8 Operational Land Imager, the team created maps of impervious surface and tree canopy cover change from 2000 to 2019 for the City of Hampton. These maps supported City of Hampton officials in directing resiliency efforts towards areas of greatest vulnerability within their municipality. Additionally, the team used the Impervious Surface Analysis Tool (ISAT) to illustrate how changes in impervious surface coverage impact local water quality and how different land management scenarios might alter these consequences. The team’s methodology will allow city officials to create updated impervious surface and tree canopy cover maps any time new imagery becomes available. Moreover, the team supported the city officials’ goals of using a place-based approach by demonstrating how the methodology can be applied to the smaller Newmarket Creek watershed in order to empower residents as active custodians of the environment.