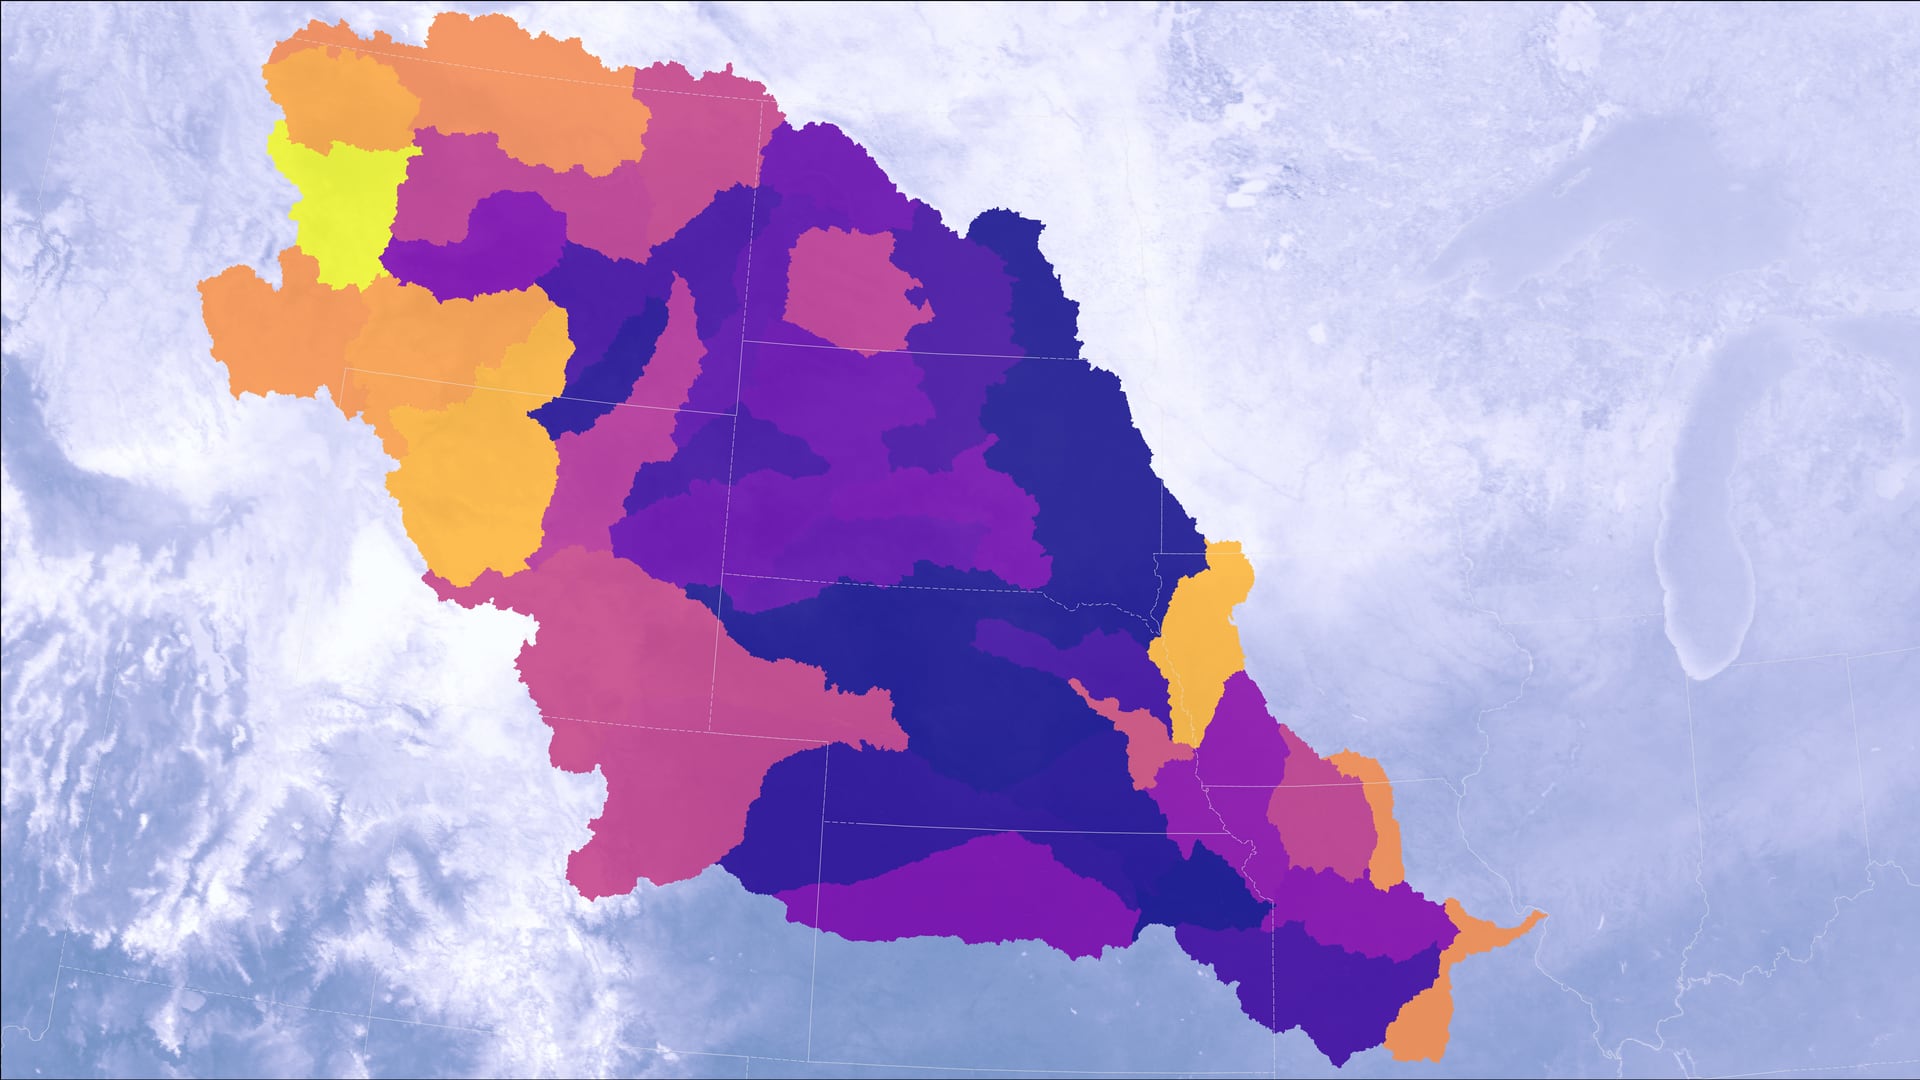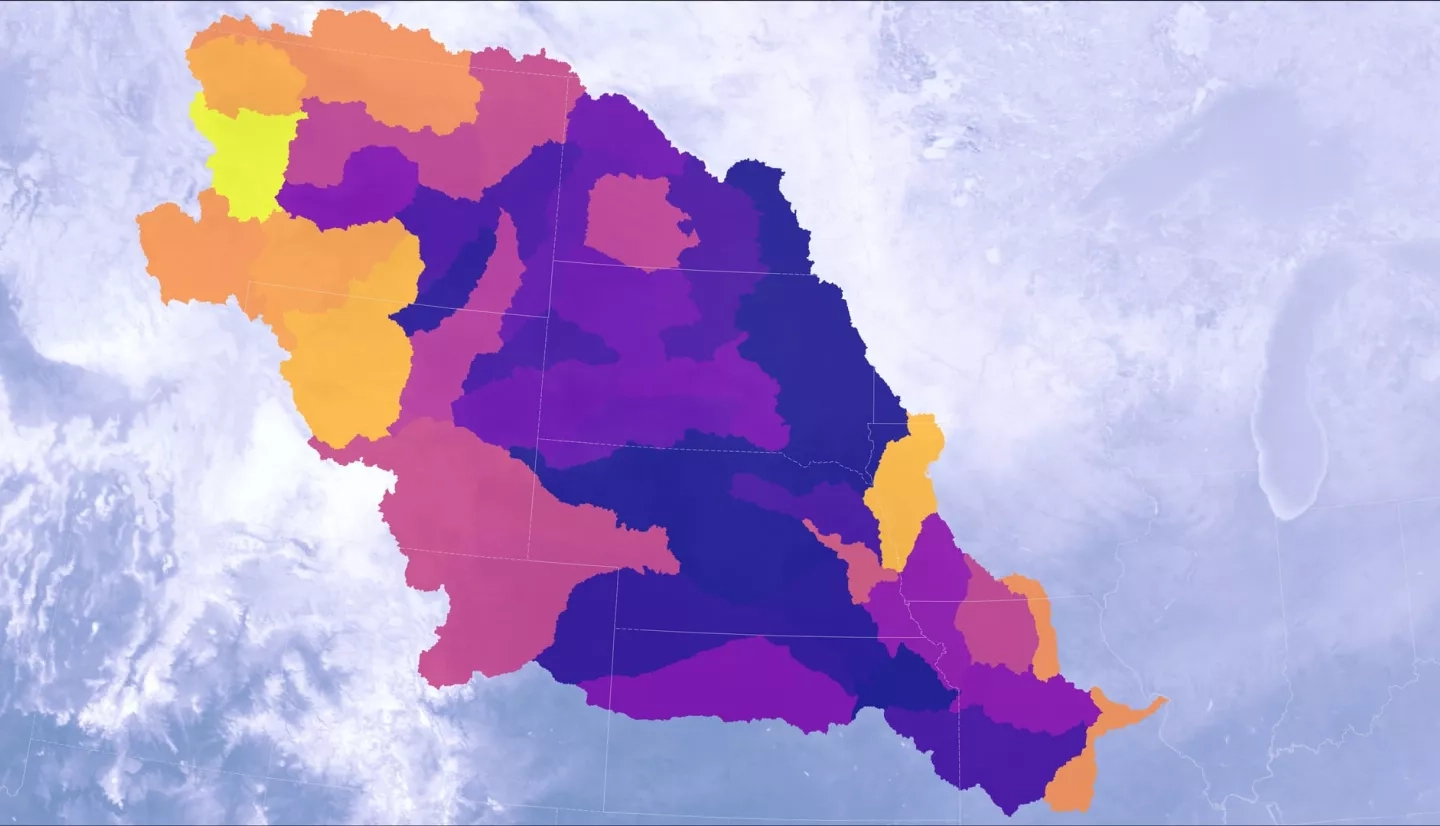
The Missouri River Basin provides irrigation water for a substantial part of the domestic agricultural sector within the United States. Drought events pose a significant threat to the economic livelihoods of dependent individuals, industries, and ecosystems (e.g. farmers, local tribes, hydroelectric power, wildlife). In 2017 alone, the Missouri River Basin experienced a severe drought that resulted in a $2.6 billion loss to the U.S. Northern Plains. In response to such events, organizations throughout the basin, such as the Montana Climate Office, have dedicated efforts for drought monitoring and communicating relevant information to local stakeholders. In an effort to aid regional decision-making capabilities, the project team partnered with the Montana Climate Office, NOAA National Weather Service (NWS) Missouri Basin River Forecast Center, and NOAA Regional Climate Services, Central Region to create a monthly Composite Moisture Index (CMI) that relies on NASA Earth observations from the Terra Moderate Resolution Imaging Spectroradiometer (MODIS) and the Soil Moisture Active Passive (SMAP) mission. From these satellites, as well as the NOAA NWS National Operational Hydrologic Remote Sensing Center’s Snow Data Assimilation System (SNODAS), our team aggregated climate datasets including soil moisture, snow cover, snow depth, and snow water equivalent to compute a CMI that indicates regional moisture conditions during the winter months. The March CMI values produced over the Missouri River headwater subbasin strongly correlate (r = 0.75) with spring and early summer stream discharge, demonstrating the use of this metric to indicate moisture conditions for the snowmelt and growing seasons.


