Imagen
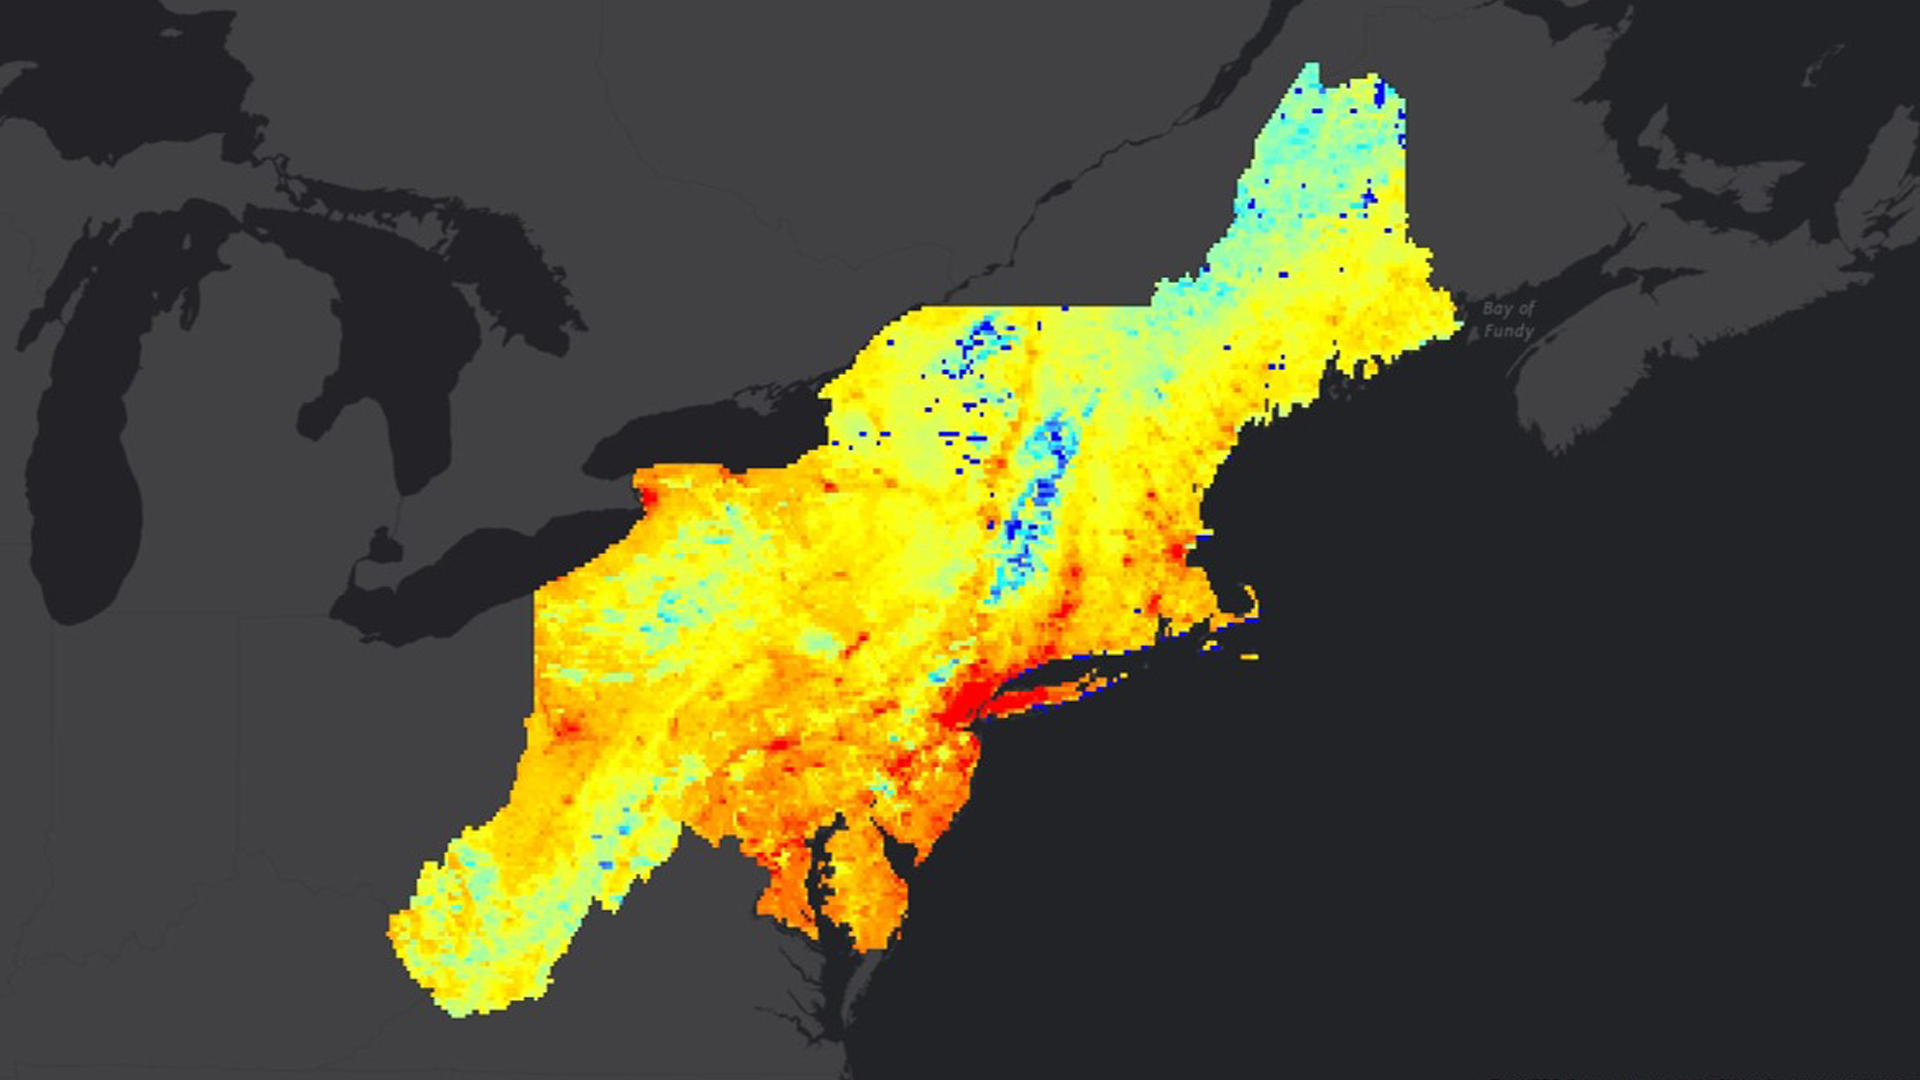
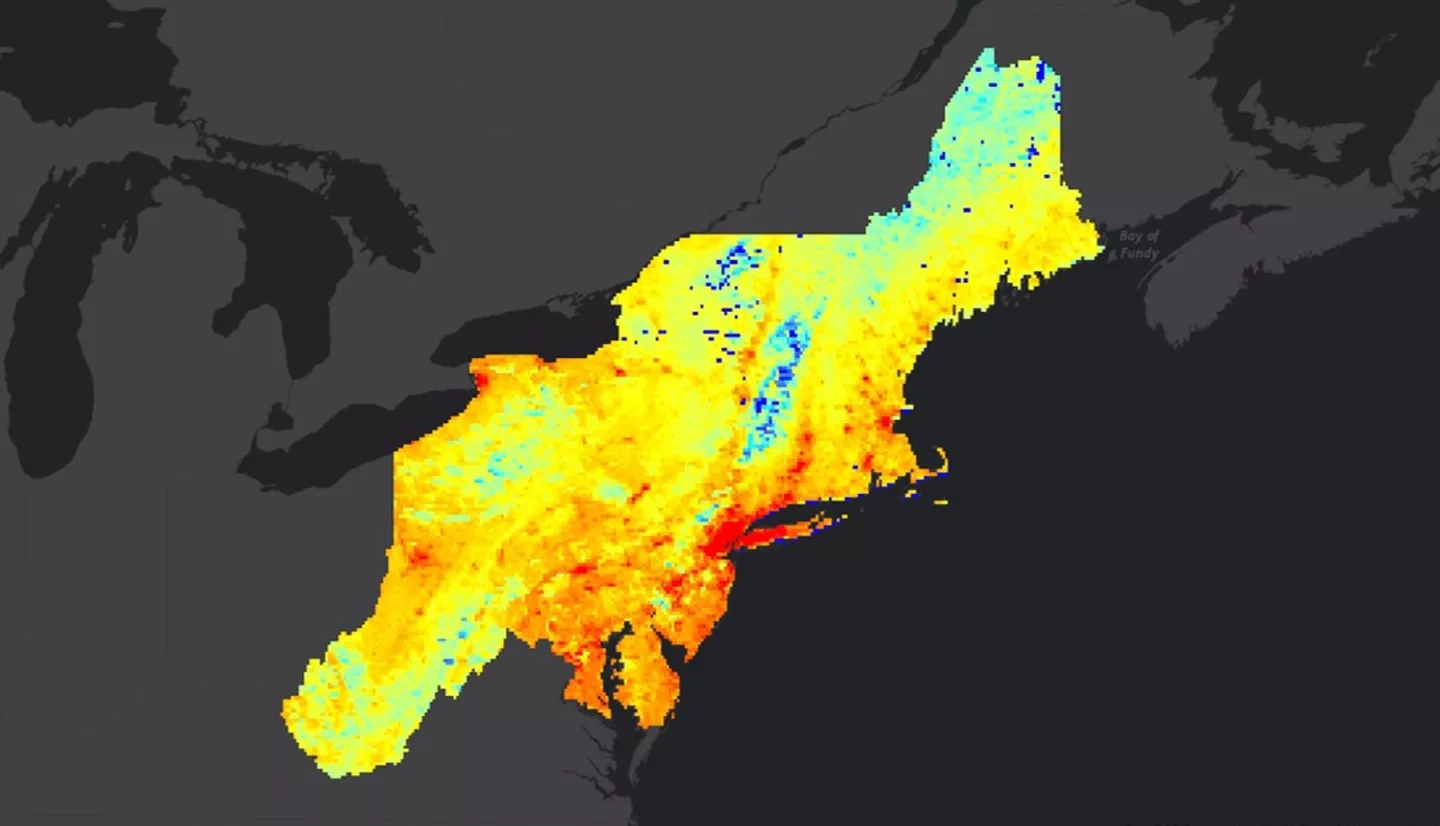
Since 1977, every year has been in the top ten warmest years on record when first ranked, reflecting the upward progression of annual global temperatures. However, some years within this time frame, such as 2012, are significantly cooler than surrounding years like 2010 or 2013. The variability of yearly rankings makes it difficult to differentiate the relative warmth or coolness of individual years from the secular trend. This project consists of two parts. First, the team devised a simple algorithm to create monthly, seasonal, and annual temperature scores regionally, within the Northeast US, and globally for the time periods ranging from 1975 to 2016 and 1880 to 2016. The temperature score product allows users to differentiate the relative coolness or warmth of a particular year in regard to the warmth or coolness of surrounding years from the overall temperature rankings. The algorithm also provides context for the temperatures in the Northeast region, accounting for recent year-to-year fluctuations with respect to longer term trends. Secondly, this project utilized daily Aqua and Terra MODIS Land Surface Temperature (LST) data to provide useful, high-resolution temperature-based metrics to the energy and agriculture industries. This consisted of producing heating, cooling and growing degree days (for energy and agriculture industries respectively) for the Northeast US using satellite derived data. The results from this study, which give users the ability to visualize maps of monthly degree days at a higher spatial resolution than indices previously available, are expected to be distributed to various clients by NOAA's Northeast Regional Climate Services Directorate and Climate Monitoring Branch.