Imagen
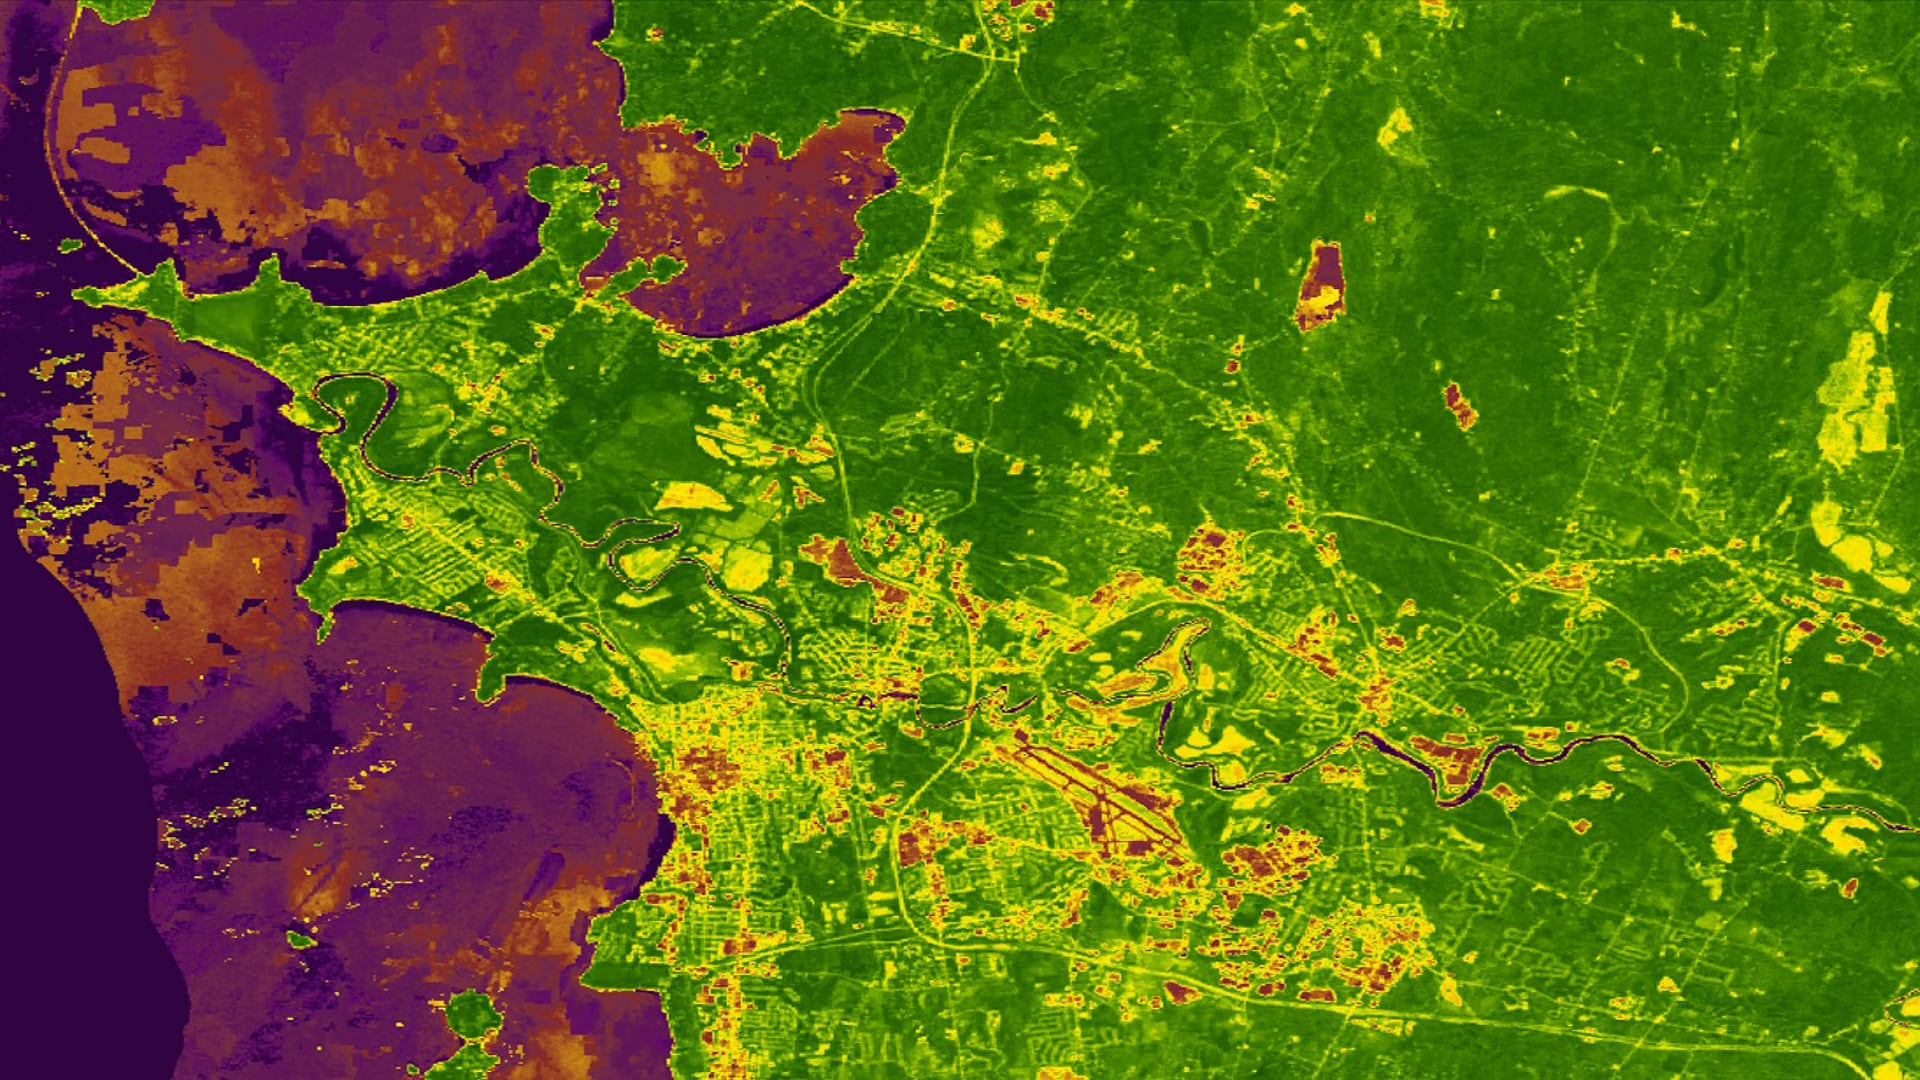
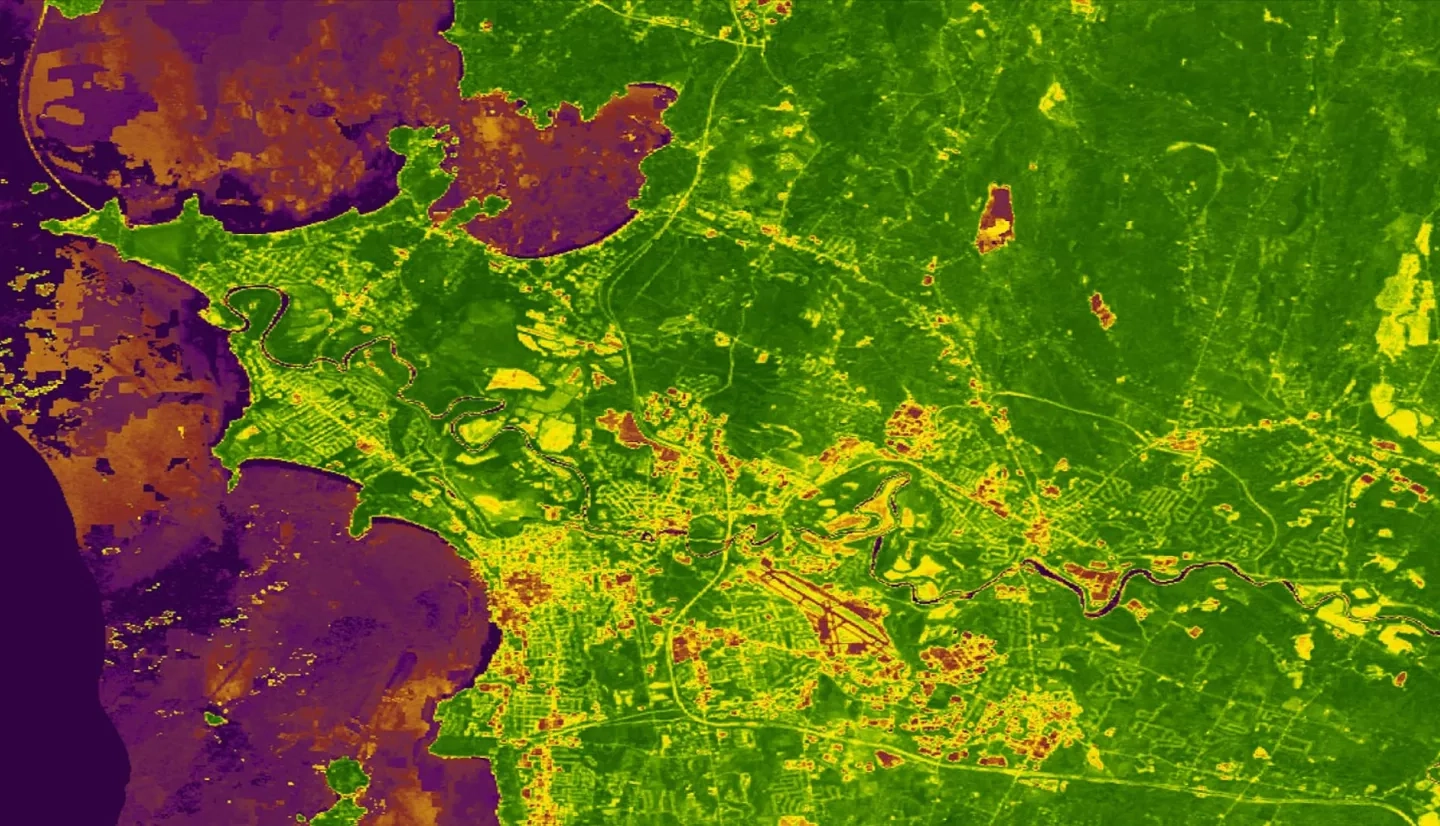
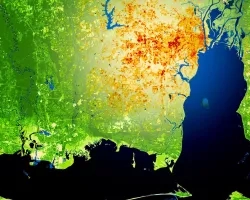
syrup production has historically been at the heart of Vermont’s cultural and economic identity. In 2018, the state was the leading producer in the US, generating 46.6 percent of the country’s maple syrup. However, temperature fluctuations, drought, and variable defoliation caused by the forest tent caterpillar (Malacosoma disstria) have impacted the sugar maple tree (Acer saccharum), a keystone species and agroforestry crop necessary for maple syrup production. NASA DEVELOP partnered with the University of Vermont’s (UVM) Proctor Maple Research Center, Extension Maple Program, and Spatial Analysis Laboratory to analyze sugar maple stand longevity and habitat suitability. Satellite imagery was utilized from Landsat 5 Thematic Mapper (TM), Landsat 8 Operational Land Imager (OLI), and Terra Advanced Spaceborne Thermal Emission and Reflection Radiometer (ASTER) to conduct sugarbush health analyses and create a model for suitable sugarbush habitat. The Normalized Difference Vegetation Index (NDVI) and Enhanced Vegetation Index (EVI) time series were created to analyze vegetation trends between January 1987 and June 2019. A sugarbush habitat suitability model was also conducted, utilizing the results from the EVI time series along with soil and terrain data. Analysis of the sugarbush habitat suitability model allowed for the identification of optimal maple stands for maple syrup production in the state of Vermont.