Southeast US Climate (Fall 2022)
Team: Heidi Rogers (Project Lead), Mistaya Smith, Maggie Mason, Anish Holla
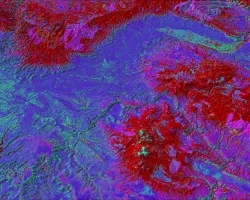
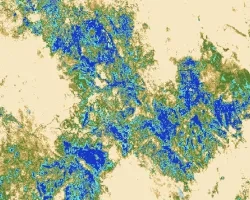
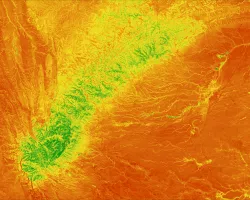
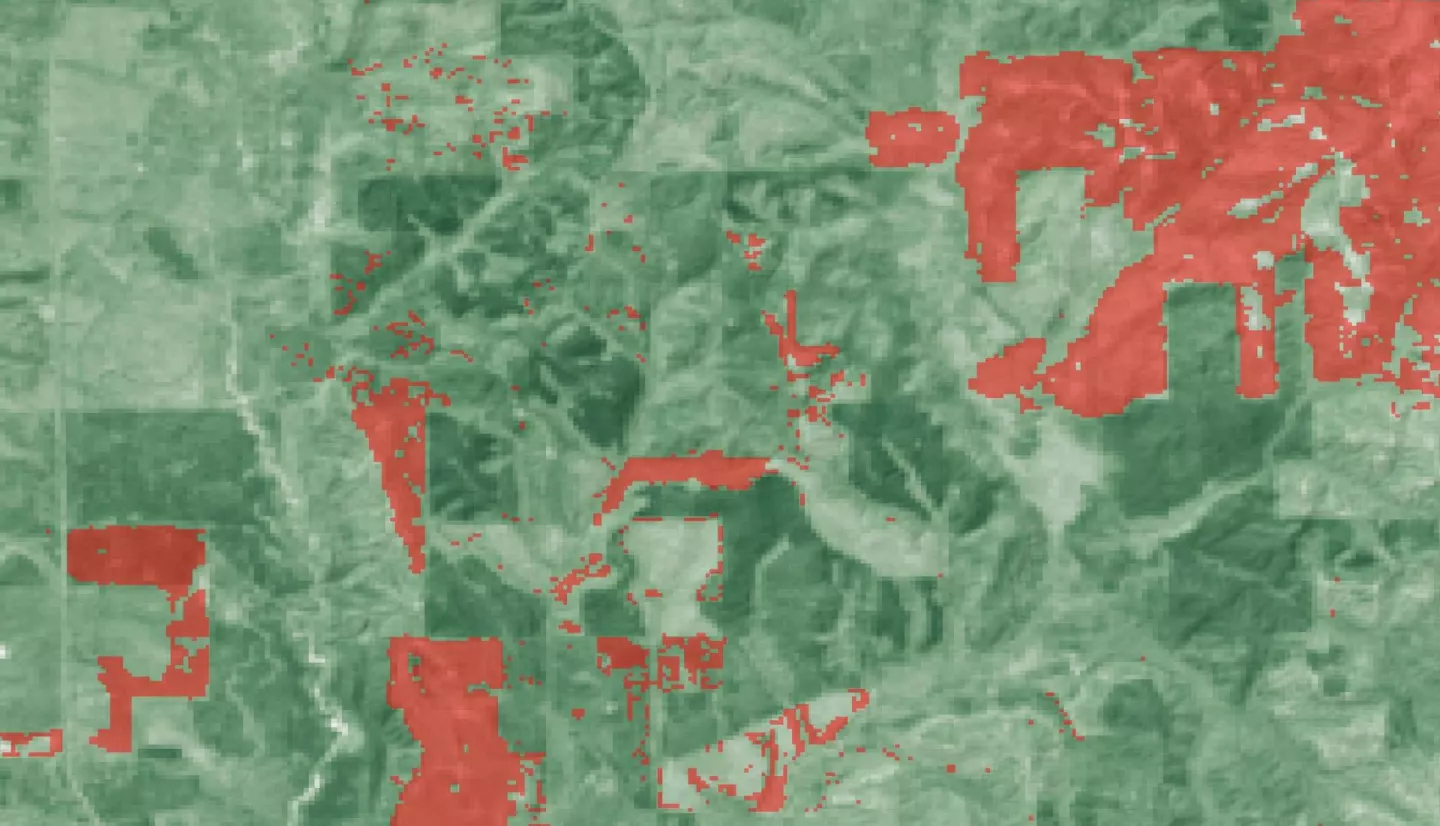
Summary: Deforestation, a significant contributor to carbon emissions, is a major driver of climate change. To best inform climate mitigation, decision-makers must have accurate estimations of carbon emitted during deforestation. However, it is challenging to assess deforestation extent and measure forest carbon stock loss from the ground given varied growing conditions. With the intent to derive remote sensing carbon monitoring methods applicable to the Southeastern United States, we adapted procedures developed by SERVIR-CArbon Pilot (S-CAP). Using Talladega National Forest in Alabama as our region of interest (ROI), we compared deforestation maps within Google Earth Engine (GEE) using LandTrendr, National Land Cover Dataset (NLCD), Landscape Change Monitoring System (LCMS) dataset, and Global Forest Watch (GFW) dataset. These data sources utilized imagery from Landsat 5 Thematic Mapper (TM), Landsat 7 Enhanced Thematic Mapper Plus (ETM+), and Landsat 8 Operational Land Imager (OLI). We then used ICESat-2 Advanced Topographic Laser Altimetry System (ATLAS) and ISS Global Ecosystem Dynamics Investigation (GEDI) observations to calculate aboveground biomass (AGB) loss and total carbon emissions from deforestation in the ROI. We explored the accuracy of ATLAS with airborne LiDAR data. Our results indicated that 0.02% to 8.0% of the ROI was deforested, which equates to 54,735 to 3,975,540 tons of carbon emissions for 2016-2021. We found that ATLAS data consistently overestimated tree canopy height relative to the same metric from airborne LiDAR. This work supports future DEVELOP teams who can use our tutorial and documented Google Earth Engine scripts for aiding carbon stock assessments for applications in the Southeastern US.
Related Impact