Displaying 1 - 10 of 16
![Satellite image of smoke from wildfires.](/sites/default/files/styles/lis/public/2021-03/Wildfires_Header.png.webp?itok=eTz5Y-T-)
Training Type
Level
Intermediate
Date
May 11, 2021 - May 27, 2021
![Satellite image of smoke from wildfires.](/sites/default/files/styles/lis/public/2021-03/Wildfires_Header.png.webp?itok=eTz5Y-T-)
Training Type
Level
Intermediate
Date
May 11, 2021 - May 27, 2021
![2022 Spring AZ Phoenix Climate Website Image](/sites/default/files/styles/lis/public/2022-06/2022Spring_AZ_PhoenixClimate_WebsiteImage_v2.png.webp?itok=UX2zeyTY)
Topic
Phoenix Climate (Spring 2022) Team: Alison Bautista (Project Lead), Haley Stuckmeyer, Gloria Liu, Ben Schafermeyer Summary: Phoenix, Arizona is the hottest city in the United...
![Present day Island of Hawai'i coastal flood risk, with higher risk indicated in dark blue, was modeled to aid the County of Hawai'i in their shoreline setback plan. Sea Surface Temperature Anomaly (SSTA) data from 2022 GHRSST MODIS indicate low temperatures in the East (red) to high in the West (orange). Inland, high probability locations of wetlands are shown in bright yellow and will aid in climate adaptation planning. ](/sites/default/files/styles/lis/public/2022-11/2022Sum_AZ_HawaiiClimate_WebsiteImage_0.jpg.webp?itok=k16qFZYS)
Topic
Hawai'i Island Climate (Summer 2022) Team: Lisa Tanh (Project Lead), Ian Lee, Connor Racette, Matilda Anokye Summary: Climate-induced sea level rise poses a risk to...
![NDVI-processed imagery from Landsat 8 OLI data. This composite image of Wichita, KS, was created using 2018–2022 summer imagery. Lighter shades of yellow indicate limited vegetation in built-up areas and bodies of water, while darker shades of purple indicate dense vegetation. Understanding the spatial distribution of vegetation, such as tree canopy, is essential to recognizing and mitigating heat risk, and prioritizing intervention.](/sites/default/files/styles/lis/public/2022-11/2022Sum_VEJ_WichitaClimate_WebsiteImage.jpg.webp?itok=1WmU74Wp)
Topic
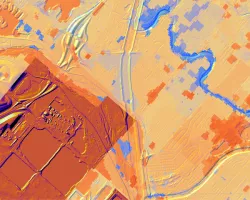
Wichita Climate (Summer 2022) Team: Brooke Laird (Project Lead), Melissa Ashbaugh, Muskaan Khemani, Sadie Murray Summary: Wichita, Kansas is facing a host of climate threats...
![Fall 2022 Maldives Climate](/sites/default/files/styles/lis/public/2023-02/2022Fall_ARC_MaldivesClimate_WebsiteImage.jpg.webp?itok=6Go_gwk1)
Topic
Maldives Climate (Fall 2022) Team: Aidan Harvey (Project Lead), Daniel Lopez, Mitch Porter, Derek Chin Summary: Global sea level rise as a result of climate...
![Landsat 8 OLI data processed into the median NDVI for 2016-2021 with an overlay showing deforestation that occurred during this time period in the Talladega National Forest. The deforestation layer is derived from Global Forest Watch's forest cover data, which uses the Landsat series, and was calculated as the difference between forested areas in 2016 and forested areas in 2021. Shades of green indicate the density of forest, while red areas indicate areas deforested in 2021.](/sites/default/files/styles/lis/public/2023-02/2022Fall_PUP_SoutheastUSClimate_WebsiteImage.jpeg.webp?itok=9thA-LxI)
Topic
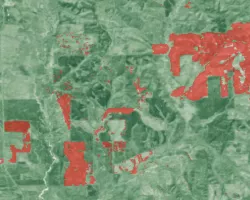
Southeast US Climate (Fall 2022) Team: Heidi Rogers (Project Lead), Mistaya Smith, Maggie Mason, Anish Holla Summary: Deforestation, a significant contributor to carbon emissions, is...
![Daytime land surface temperature for Wichita, Kansas summer 2017-2022, retrieved through Landsat 8 TIRS and Landsat 9 TIRS-2 surface temperature. Located in the northwest corner of the city, this image depicts higher temperatures through dark orange hues in developed areas, and lighter orange hues to blue colors where the temperature is lower. The land surface temperature was utilized to construct a heat vulnerability index for the city, looking into disproportionate impacts on underserved communities.](/sites/default/files/styles/lis/public/2023-02/2022Fall_VEJ_WichitaClimateII_WebsiteImage.png.webp?itok=oO4F6bs4)
Topic
Wichita Climate II (Fall 2022) Team: Ritisha Ghosh (Project Lead), Richard Kirschner, Ria Mukherjee, Raina Monaghan Summary: Wichita, Kansas is experiencing a host of climate...
![Eastern region of the Baa Atoll in the Republic of Maldives. The red indicates areas that would likely be flooded by 2100 according to the most extreme IPCC AR6 Shared Socioeconomic Pathway scenario, as identified through the NASA Sea Level Projection Tool. CoastalDEM, derived from NASA's SRTM sensor, provided elevation data. The base map image was taken in January 2023 by Planet Labs. Shades of yellow and green indicate shallow water and land surfaces. Includes copyrighted material of Planet Labs PBC. All](/sites/default/files/styles/lis/public/2023-04/2023Spring_ARC_MaldivesClimateII_WebsiteImage.jpg.webp?itok=U9qoVeWo)
Topic
Maldives Climate II (Spring 2023) Team: Ben Dahan (Project Lead), Evan Barrett, Tiffany Hsu, Gabriel Halaweh Summary: The Republic of the Maldives is a low-lying...
![Soil organic carbon (SOC) is measured here for a depth of 0-5cm from Soil Moisture Active Passive from January 1, 2021 over Peru and Bolivia. SOC is visualized against combined MODIS landcover data for the year 2000 from Aqua and Terra. Shades of lighter pink indicate lower SOC content and darker shades of pink and purple indicate higher SOC content. Conservation International is interested in mapping areas of high SOC content for their conservation efforts.](/sites/default/files/styles/lis/public/2023-05/2023Spring_GSFC_Peru%26BoliviaClimate_WebsiteImage.jpg.webp?itok=RJ-8Cuuo)
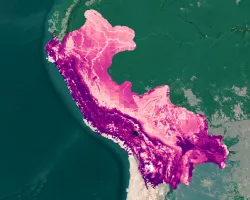
Peru & Bolivia Climate (2023 Spring) Team: Aarti Arora (Project Lead), Aaron Carr, Arina Fuqua, Haydee Portillo Summary: Irrecoverable carbon (IC) reserves contain large stores...