Displaying 21 - 30 of 81
![](/sites/default/files/styles/lis/public/images/develop-legacy/2018/summer/images/2018Sum_ID_IdahoWater.jpg.webp?itok=0w-cdqNo)
Topic
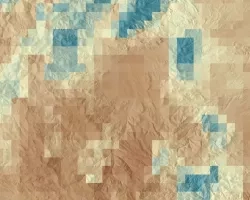
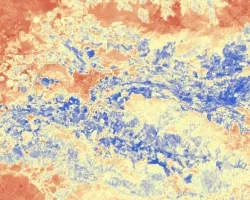
Soil moisture is a critical component of ecosystem health, particularly in semi-arid landscapes where seasonal and infrequent precipitation is one of the primary controls on...
![](/sites/default/files/styles/lis/public/images/develop-legacy/2020/spring/images/2020Spring_JPL_GreatLakesWaterII_WebsiteImage.jpg.webp?itok=KG17RNew)
Topic
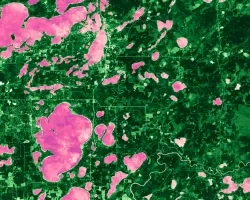
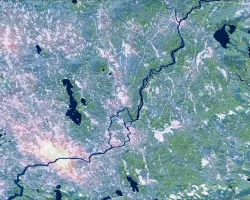
The Great Lakes Basin is one of the world’s largest freshwater ecosystems. The Basin harbors over 200,000 acres of wetlands that provide a variety of...
![](/sites/default/files/styles/lis/public/images/develop-legacy/2019/spring/images/2019Spring_JPL_GreatLakesWater_WebsiteImage.jpg.webp?itok=BHzl6sJi)
Topic
Wetlands are a critical feature of our landscape for the ecological services they provide, including protecting water quality, providing habitat to rare species, mitigating erosion...
![Landsat 8 OLI derived MNDWI imagery mosaicked from October 17, 2020, to December 2, 2020. Located near the Río Patuca (Patuca River) in Ahuas, Honduras, permanent water and flood is represented as bright red and orange while blue depicts other land cover types and clouds. Examining floods from disasters like Hurricanes Eta and Iota helps decision makers improve mitigation and response efforts.](/sites/default/files/styles/lis/public/2022-03/2021Fall_MSFC_CentralAmericaDisasters_WebsiteImage.png.webp?itok=pweSILBO)
Central America Disasters (Fall 2021) Team: Caroline Williams (Project Lead), Lauren Carey, Maria De Los Santos, Deanna Fanelli, and Payton Ireland Summary: In November 2020...
![Annual max biomass calculated from 2021 daily Harmonized LandSat Sentinel-2 (HLS) dataset. Dark purple colors show low biomass while the bright orange show high biomass. Regions with high vegetation and tree canopy cover are shown in orange on the left of the image. High biomass values are of an interest to rangeland managers to help inform their grazing decisions based on which areas of the ranch produce the most biomass/vegetation.](/sites/default/files/styles/lis/public/2023-02/2022Fall_CO_EasternPlainsAgr_WebsiteImage.jpg.webp?itok=StO3rYYa)
Eastern Plains Agriculture (Fall 2022) Team: Jillian Joubert, Sarah Hettema, Deni Ranguelova, TR Ingram, Max Stewart Summary: Adaptive management on cattle ranches requires rangeland managers...
![Potential for land cover to change from trees to grass, forb, and herb between 1987 and 2020 in the Teton Mountain Range. Image created from LCMS land cover data which are derived from Landsat 4, 5, 7, and 8 imagery (1987 - 2020). High transition potential is depicted in yellow and low transition potential is indigo. Transition potentials help to forecast land cover and inform land managers on the locations of suitable bighorn sheep habitat.](/sites/default/files/styles/lis/public/2022-03/2021Fall_ID_GrandTetonEco_WebsiteImage.png.webp?itok=q05PkvLT)
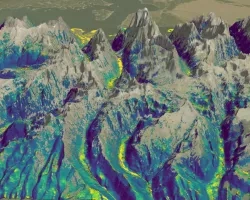
Grand Teton Ecological Forecasting (Fall 2021) Team: Alex Posen (Project Lead), Allyson Earl, Sarah Hettema, and Michael Hitchner Summary: Grand Teton National Park provides habitat...
![Median daily evapotranspiration (ET) from September 2021 to May 2022 calculated from ISS ECOSTRESS data. The image covers the agricultural fields adjacent to the Maipo River, Chile and depicts water stress. The color scale ranges from red (low ET) to blue (high ET), with higher ET observed over irrigated agricultural fields. ET is used for estimating crop irrigation requirements. This data will inform irrigation management practices and help alleviate water scarcity within the area. ](/sites/default/files/styles/lis/public/2022-11/2022Sum_PUP_MaipoRiverValleyAg_WebsiteImage.jpg.webp?itok=DiGPgMrj)
Maipo River Valley Agriculture (Summer 2022) Team: Benjamin Goffin (Project Lead), Duncan Srsic, Rishudh, Sarah Carlos Summary: Agriculture is the primary use of water in...
![Magnitude of largest model break in Continuous Change Detection Algorithm harmonic regression model, indicative of clearcut logging in the Oregon coast range forests. Imagery from Landsat 4-5 TM, Landsat 7 ETM+, and Landsat 8-9 OLI from across the study period 2000-2021 over standard hill shade. Patches of blue show clear cut areas with lavender then yellow indicating higher magnitude. Green areas represent forests untouched during the study period.](/sites/default/files/styles/lis/public/2024-01/2023Sum_MA_OregonCoastRangeEco_websiteImage.jpg.webp?itok=sGJs5DSB)
Oregon Coast Range Ecological Conservation (Summer 2023) Team: Emily French (Project Lead), Uma Edulbehram, Sarah Hughes, Madison Arndt Summary: Logging operations are widespread across the...
![Forest cover and land surface temperature (LST) around Maine's Penobscot River during Summer 2021. The shades of green distinguish between evergreen (dark) and deciduous (light) forest which were classified using Landsat 8 OLI imagery. The purple gradient corresponds to LST derived from Terra MODIS where the warmest areas, including Bangor, are white. Changing land use and warming temperatures along Maine’s rivers are associated with reducing juvenile Atlantic salmon (Salmo salar) survivorship.](/sites/default/files/styles/lis/public/2022-11/2022Sum_GSFC_MaineEcoIII_WebsiteImage.jpg.webp?itok=EiYDdUqO)
Maine Ecological Forecasting III (Summer 2022) Team: Jonathan Falciani (Project Lead), Colin Hogan, Linda Mitchell, Makario Sarsozo Summary: Shifting patterns in land use and land...